Observability
Navigate to Observability in the project sidebar to see the observability dashboard.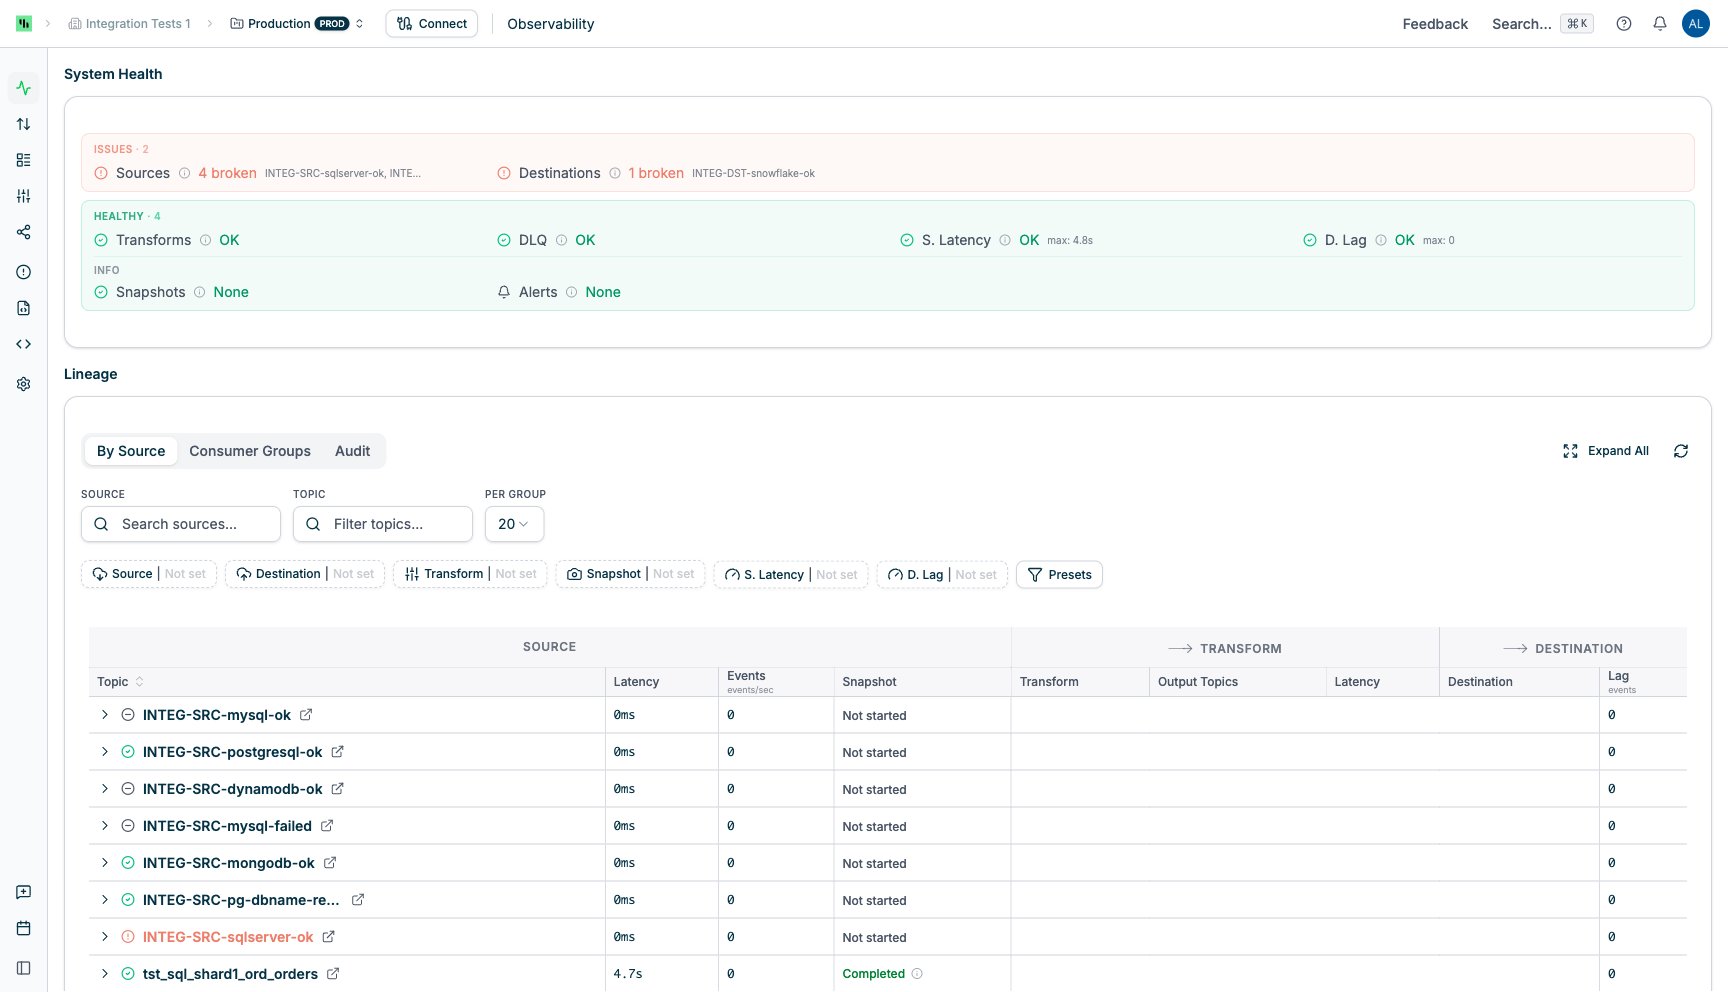
- System Health — operational status summary at the top
- Lineage — data flow details with three tabs: By Source, Consumer Groups, and Audit
System Health
Summarizes operational status. Items are grouped into colored sections based on their current state.Issues
Red section — appears only when there are active problems.Warnings
Amber section — appears only when there are active warnings.Healthy
Green section — shows all indicators that are currently OK. When everything is healthy, all issue and warning indicators appear here.Info
Shows general operational metrics below the Healthy section:Lineage
Shows how data flows through your pipelines — from sources, through optional transforms, to destinations.By Source
Groups topics by their source connector (default tab).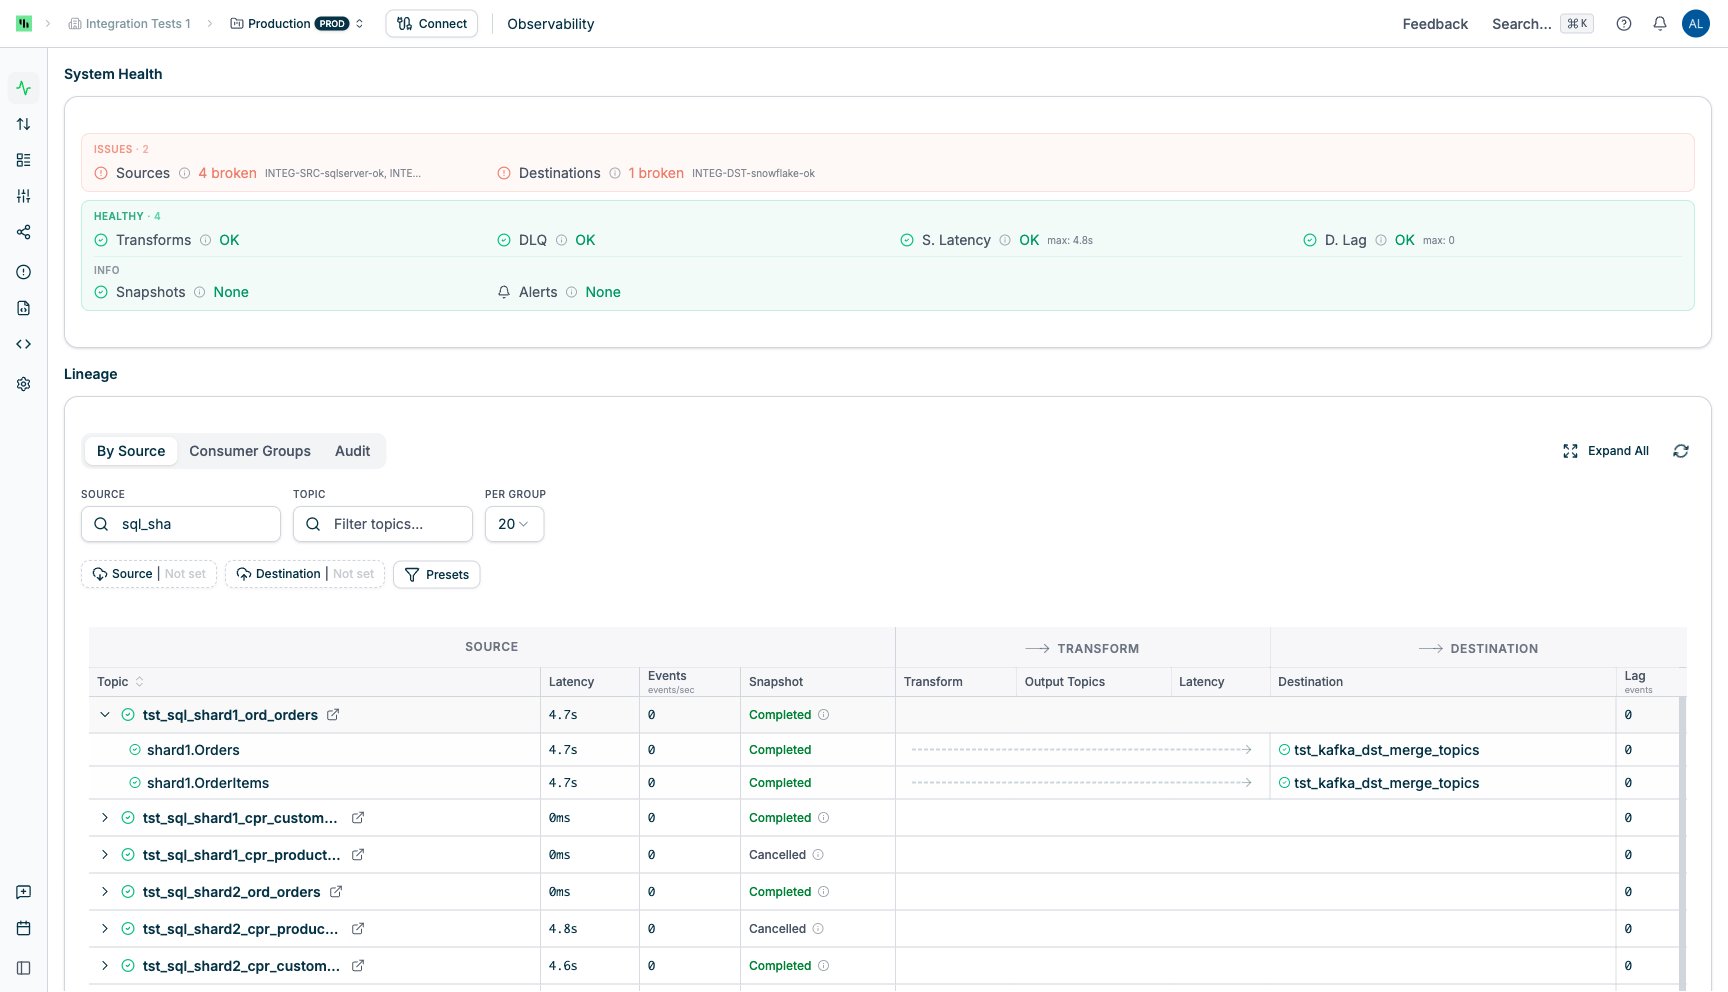
Audit
Compares record counts between sources and destinations to verify data completeness.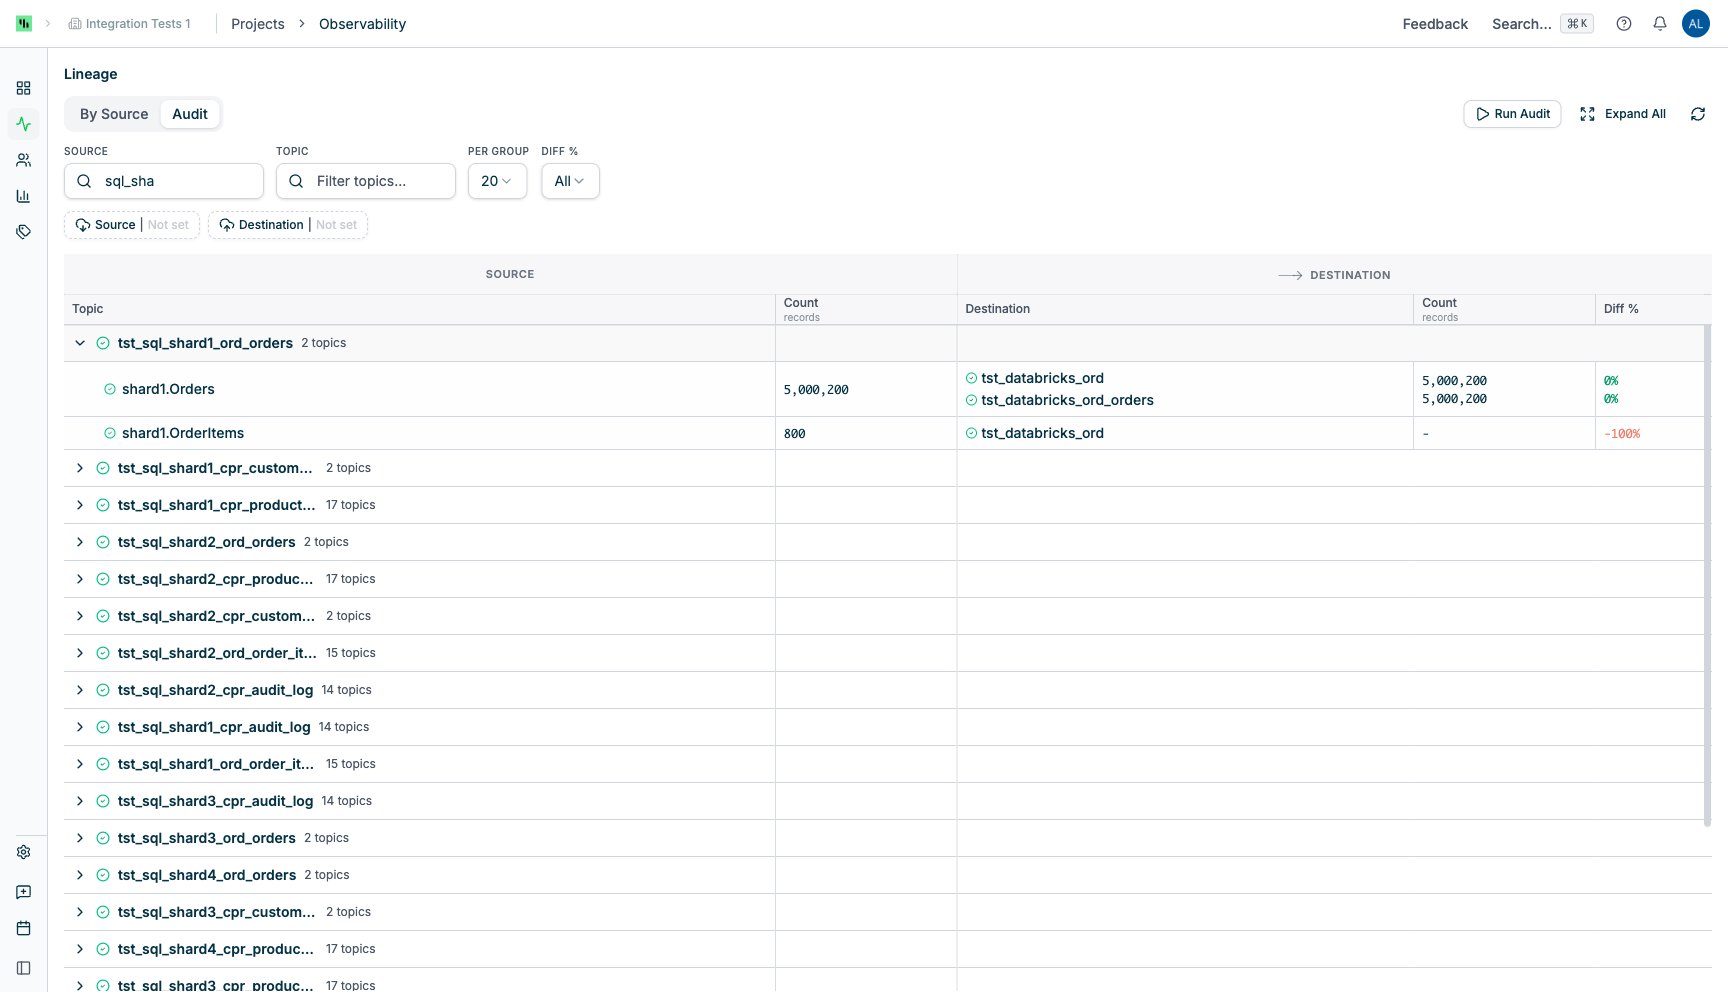
The Diff % column shows the percentage difference between source and destination record counts, color-coded by severity:
- Green (0–1%) — counts match or near-match
- Amber (2–10%) — minor drift
- Red (>10%) — significant drift
- Run Audit — triggers record count collection for all sources on the current page
- Diff % dropdown — filters topics by drift percentage range (All, 0–2%, 2–10%, 10–50%, 50–100%, >100%)
Record counts require a completed audit run. Use the Run Audit button to collect counts, then expand source groups to see the results.
Consumer Groups
Displays Kafka consumer groups and their health status.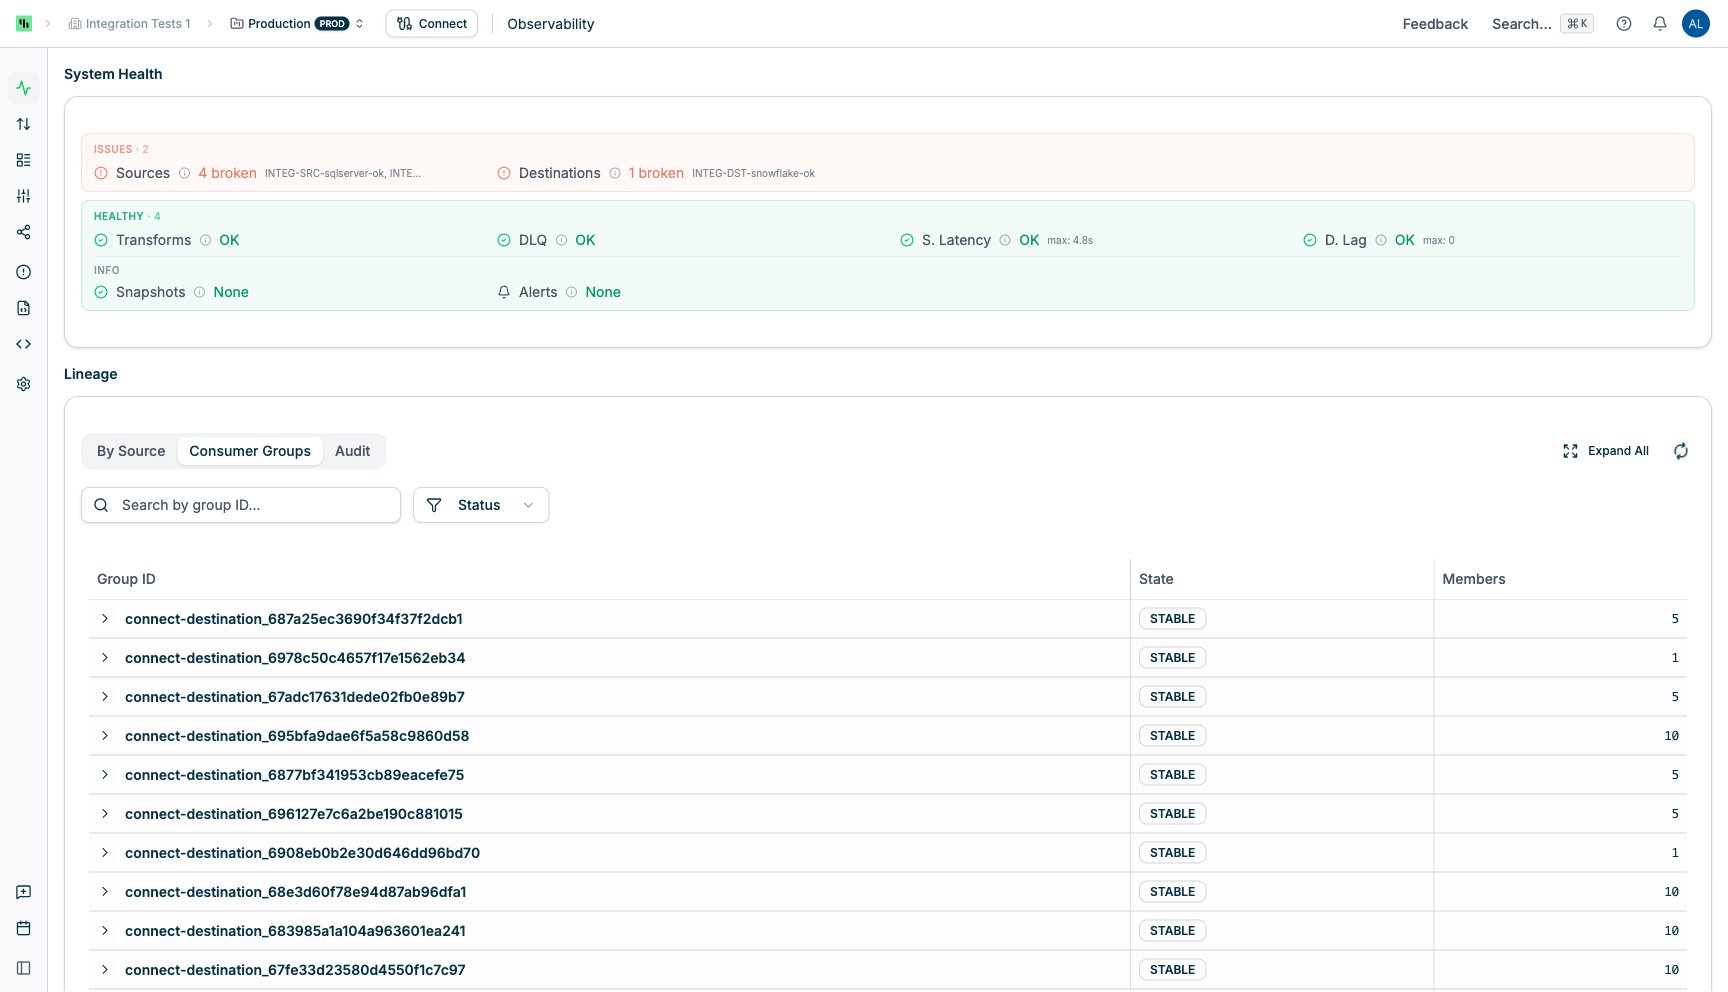
- Search — filter by group ID
- Status — filter by group state
For full consumer group management including offset resets and lag monitoring, see the Consumer Groups page.
Filters
All lineage tabs provide search, filtering, and pagination controls.Search
- Source search — server-side search on source/group names
- Topic search — filters topics within expanded groups. When active, groups auto-expand to show matching topics.
- Per group — controls how many topics display per expanded group (5, 10, 20, or 50)
Entity Filters
Filter badges appear below the search bar. Available filters vary by tab:
The S. Latency and D. Lag filters support comparison operators (
>, >=, <, <=, =, !=) with numeric values.
Presets
The Presets dropdown (By Source tab) provides quick filter toggles:- Has Destination — topics with at least one destination pipeline
- Has Transform — topics with at least one transform
- DLQ — Dead Letter Queue topics
- Orphaned — topics without destination pipelines
Pagination and Controls
- Expand All / Collapse All — toggles all groups at once
- Refresh — manually re-fetches data (auto-refreshes every 10 seconds)
- Page size — configurable items per page
- Page navigation — navigate between pages of results
Related Documentation
- Alerts — proactive notifications for pipeline issues
- Consumer Groups — consumer group management and offset resets
- Topics — Kafka topic metrics and message inspection
- Transforms — transform configuration and monitoring
- Logs — troubleshoot pipeline and connector issues
- DLQ Operations — manage dead letter queue topics