Overview
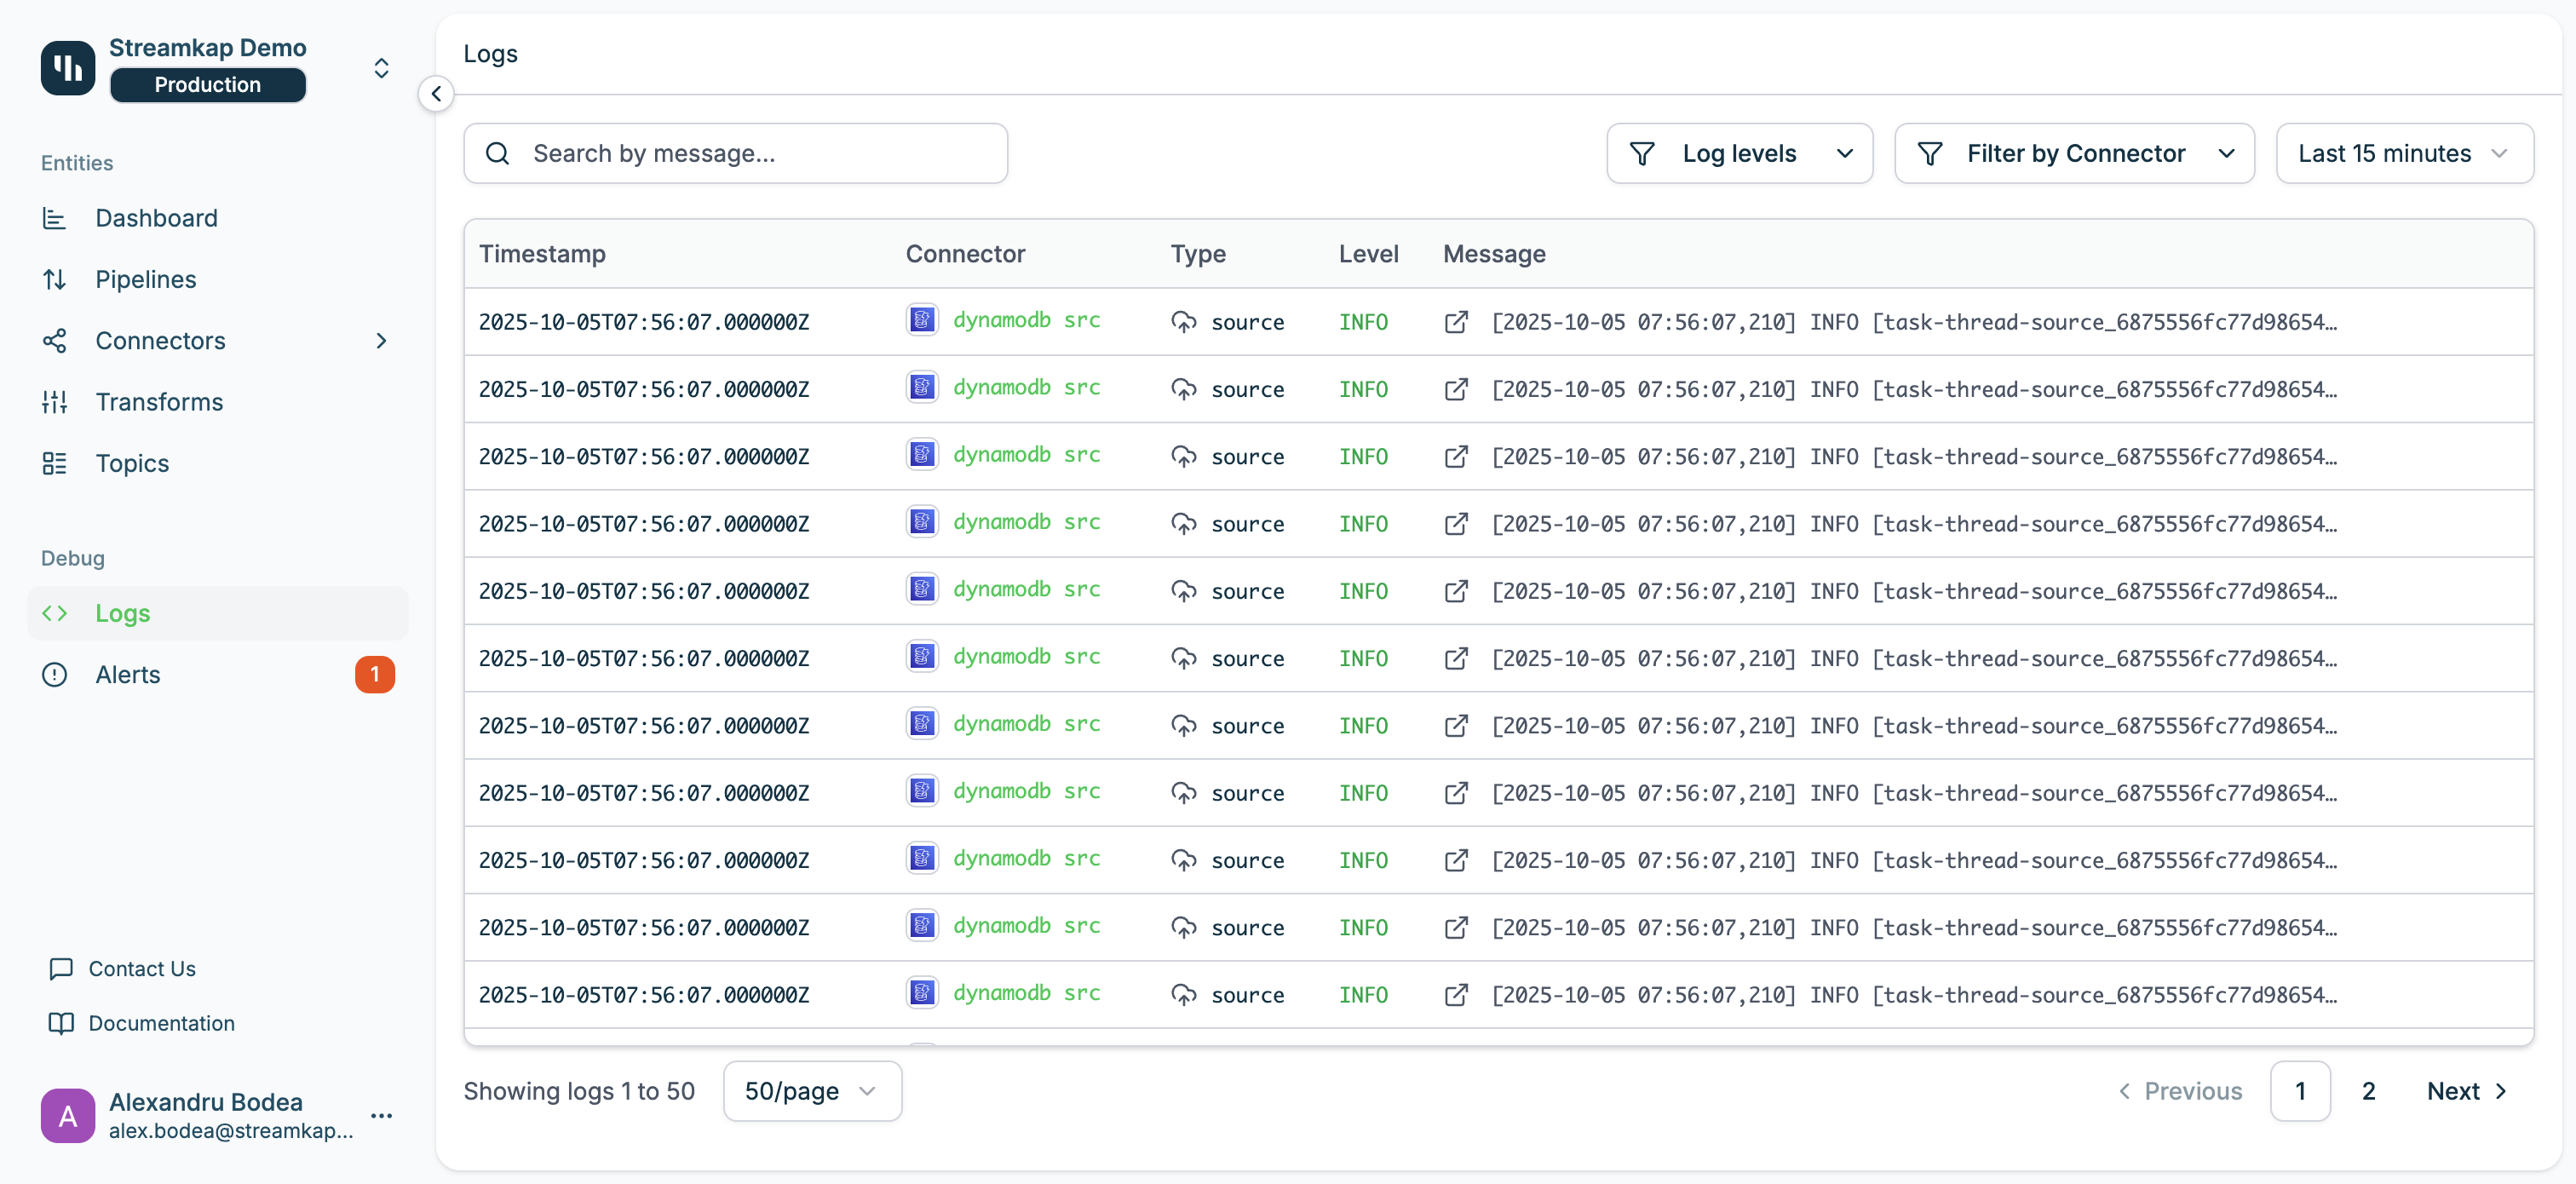
The Logs page displays a real-time stream of log messages from all connectors and system components. Use the search and filtering tools to narrow down logs to specific connectors, log levels, or time ranges.Features
Search by Message
Use the search bar at the top to filter logs by message content:- Real-time search: Filter logs as you type
- Full-text search: Searches across the entire log message including stack traces
- Case-insensitive: Search is not case-sensitive
Filter by Log Level
Click the Log levels dropdown to filter by severity:- ALL: Show all log levels (default)
- INFO: Informational messages about normal operations
- WARN: Warning messages that may require attention
- ERROR: Error messages indicating failures or issues
Multiple log levels can be selected simultaneously to view combinations (e.g., WARN + ERROR).
Filter by Connector
Click the Filter by Connector dropdown to show logs from specific connectors:- All Connectors: Show logs from all sources and destinations (default)
- Specific Connector: Select a source or destination connector by name
- Connector Type Indicator: Icon shows whether it’s a source or destination
Time Range Selection
Use the time range dropdown to control which logs are displayed:- Last 15 minutes (default)
- Last hour
- Last 24 hours
- Last 7 days
- Custom range: Select specific start and end times
Log Table
The logs table displays the following columns:- Timestamp: When the log event occurred (ISO 8601 format with millisecond precision)
- Connector: The source or destination connector that generated the log
- Connector badge shows name and type (src for source, dest for destination)
- Click to navigate to the connector detail page
- Type: The component type (source, destination, pipeline, service)
- Level: Log severity level (INFO, WARN, ERROR)
- Color-coded: green for INFO, yellow for WARN, red for ERROR
- Message: The log message content
- Click the expand icon to view full message with stack traces
Message Details
Click the expand icon (↗) on any log row to view the complete message including:- Full log text
- Stack traces (for errors)
- Thread information
- Task identifiers
- Additional context
Pagination
Navigate through logs using the pagination controls at the bottom:- Results per page: Select 10, 20, 50, or 100 logs per page
- Page navigation: Jump between pages or use Previous/Next buttons
- Result count: Shows “Showing logs 1 to 50” to track your position
Access Methods
Via Sidebar
Click Logs in the sidebar to view all logs across your service.Via Connector Detail Page
Navigate to any source or destination connector detail page and click the logs link to view pre-filtered logs for that specific connector only.Via Pipeline Detail Page
Some pipeline pages provide quick access to logs for debugging data flow issues.Common Use Cases
Debugging Failed Pipelines
- Navigate to the Logs page
- Set log level filter to ERROR
- Filter by the affected connector name
- Set time range to when the issue occurred
- Expand error messages to view stack traces
Monitoring Connector Health
- Filter logs to a specific connector
- Set log level to WARN and ERROR
- Set time range to Last 24 hours
- Look for recurring warnings or error patterns
Investigating Performance Issues
- Set log level to INFO
- Filter by the slow connector
- Search for keywords like “lag”, “latency”, or “backlog”
- Review timestamps to identify bottlenecks
Tracking Configuration Changes
- Search for “config” or “settings”
- Set log level to INFO
- Filter by time range when changes were made
- Review connector-specific logs
Best Practices
- Use Specific Filters: Narrow down logs with connector and level filters before searching to improve performance
- Monitor ERROR Logs: Set up alerts for ERROR-level logs to catch issues early (see Alerts)
- Review WARN Logs: Warnings often indicate problems before they become critical errors
- Capture Context: When reporting issues, include timestamp, connector, level, and full message
- Use Time Ranges Wisely: Shorter time ranges load faster and are easier to navigate
- Search Strategically: Use specific keywords rather than generic terms for better results
Troubleshooting
Logs Not Appearing
If logs are not displaying:- Check Time Range: Expand the time range to include when events occurred
- Clear Filters: Remove connector and log level filters to see all logs
- Verify Connector: Ensure the connector is running and generating logs
- Refresh Page: Reload the page to fetch latest logs
Performance Slow
If the Logs page loads slowly:- Reduce Time Range: Use shorter time windows (e.g., Last 15 minutes)
- Apply Filters: Filter by connector and log level before searching
- Limit Page Size: Use fewer results per page (10 or 20 instead of 100)
- Avoid Broad Searches: Use specific search terms instead of single characters
Missing Stack Traces
If error messages don’t show stack traces:- Expand Message: Click the expand icon (↗) to view full details
- Check Log Level: Ensure you’re viewing ERROR-level logs
- Verify Configuration: Some connectors may have verbose logging disabled
- Contact Support: If stack traces are consistently missing, contact Streamkap support
Related Documentation
- Alerts - Set up notifications for log events
- Pipelines - Monitor and configure data pipelines
- Sources - Troubleshoot source connectors
- Destinations - Troubleshoot destination connectors
- Topics - View message-level details for Kafka topics