Overview
The Topics page displays a searchable list of all Kafka topics in your project with filtering options and metrics: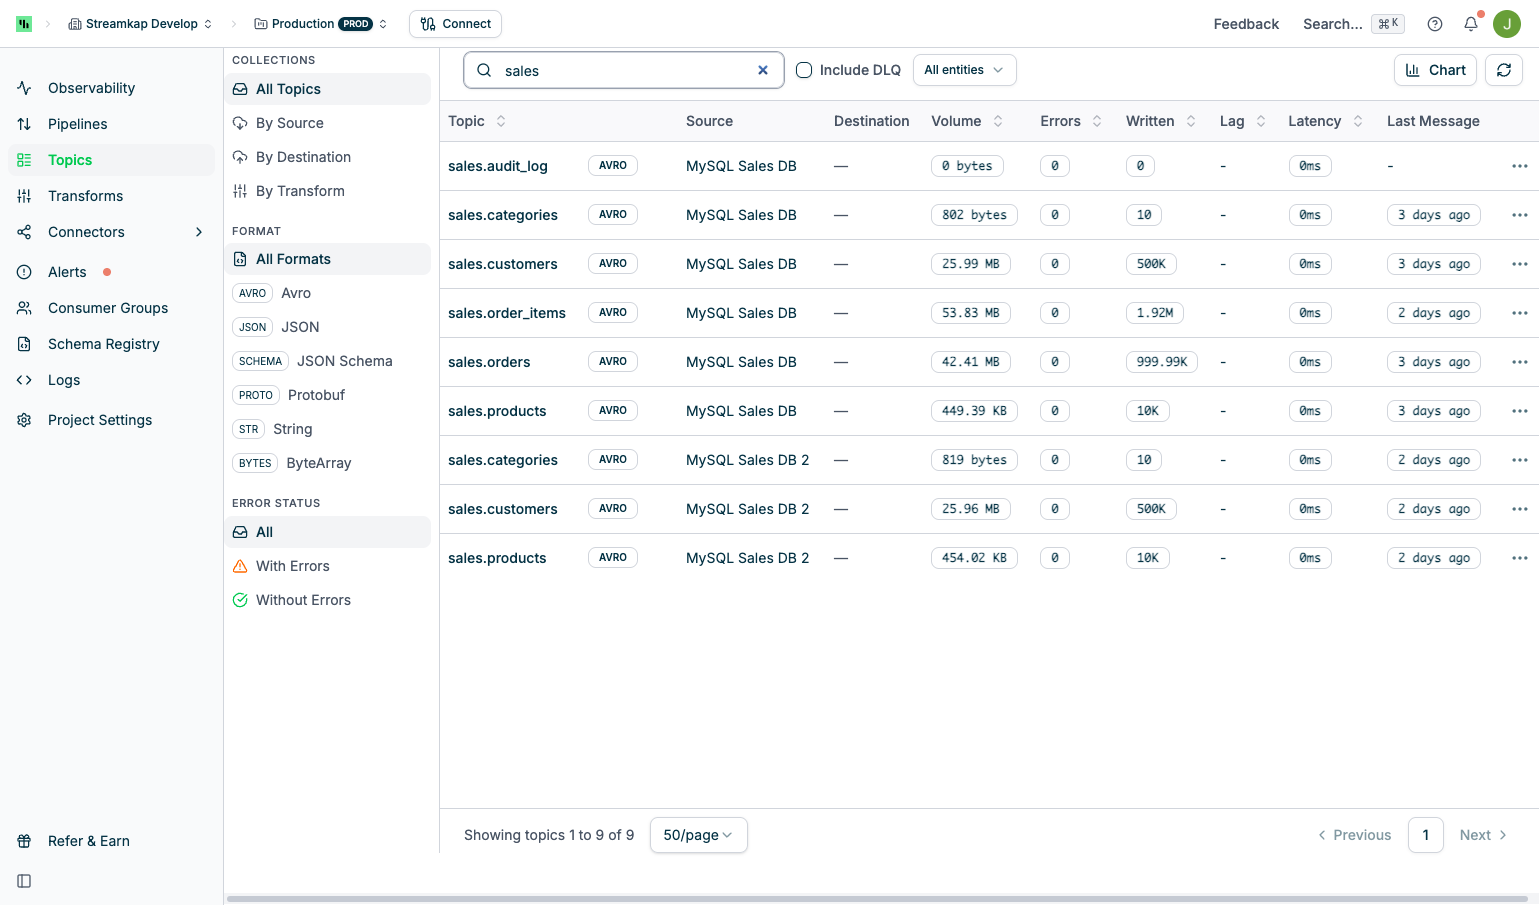
- Collections: View All Topics, or group By Source, By Destination, or By Transform
- Format: Filter by message serialization format (JSON, Avro, etc.)
- Error Status: Filter by error state to quickly identify topics with issues
- Search Box: Filter topics by name
- Include DLQ: Toggle to show or hide dead letter queue topics
- All Entities: Filter by specific source or destination connectors
- Chart Button: Toggle the metrics chart display
Metrics Chart
Metrics Chart
Click the Chart button to display an interactive time series chart: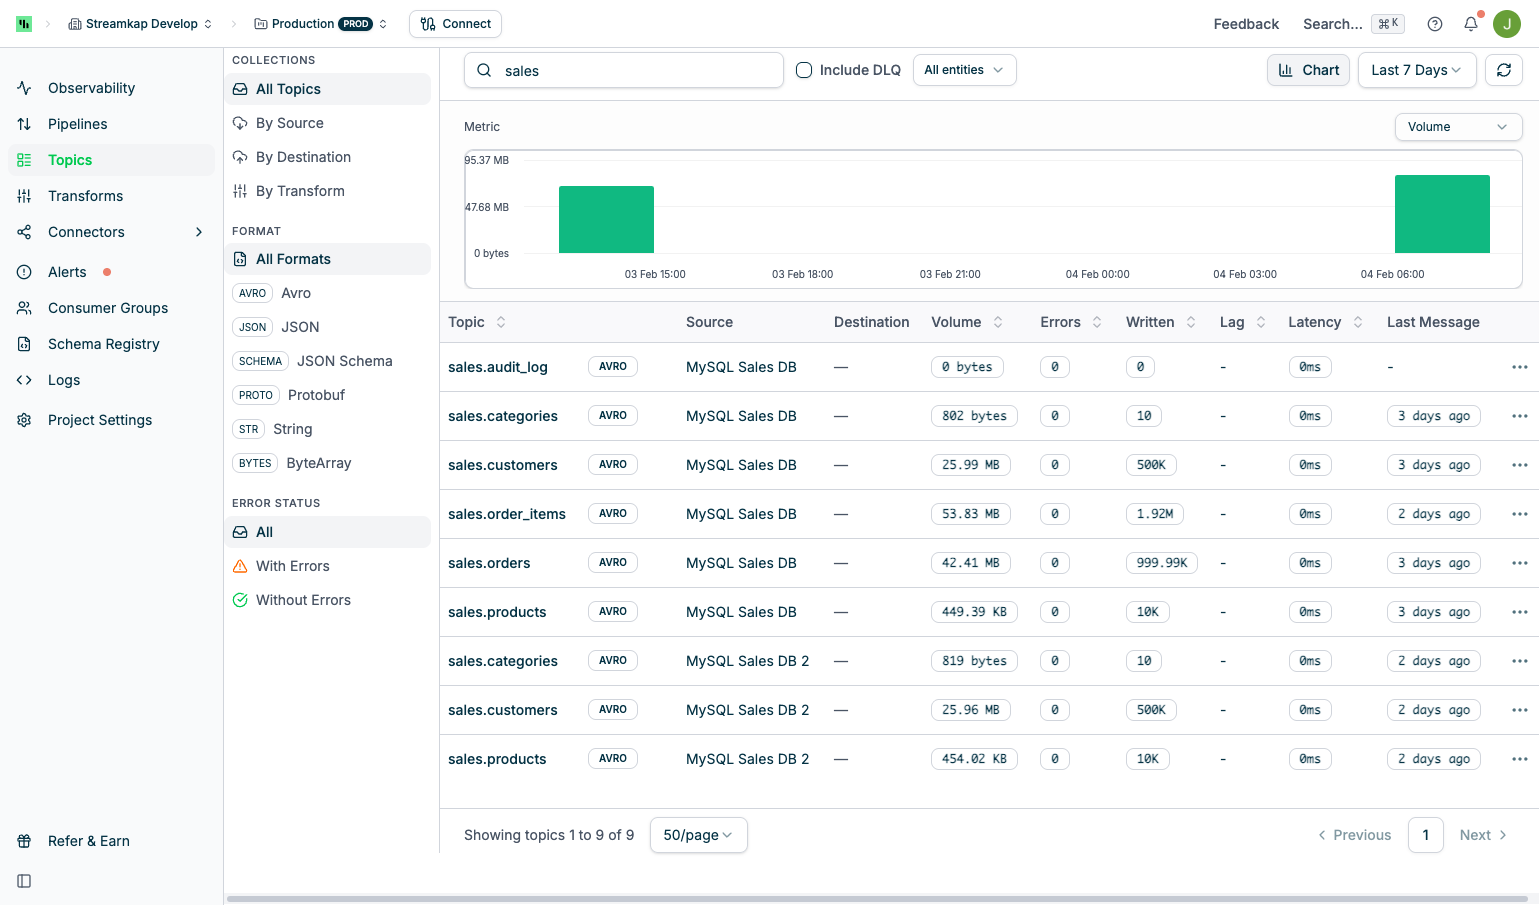
- Time Range Options: Last 24 hours, Last 7 days, Last 30 days
- Metric Selection: Toggle between Volume, Errors, and Events
- Data Granularity: Hourly data points for 24-hour view, daily aggregates for longer periods
- Hover Tooltips: View exact values at specific time points
Dead Letter Queue (DLQ) Topics
Dead Letter Queue (DLQ) Topics
Streamkap automatically creates a dead letter queue topic for each destination connector with the naming pattern:
destination_{entity_id}.streamkap.deadletterqueuePurpose:- Captures messages that fail processing at the destination
- Prevents pipeline stoppage due to individual message failures
- Enables inspection and recovery of failed messages
- Schema mismatches between source and destination
- Data type conversion errors
- Constraint violations in destination tables
- Malformed message payloads
- Check the Errors metric on the main Topics page
- Inspect DLQ topic messages in the Messages tab
- Set up alerts for DLQ activity (see Alerts)
Topic Naming Conventions
Streamkap automatically names topics based on the source type and configuration. Understanding the naming convention helps you identify topics in the list view, configure filters, and set up destination mappings.entity_id is the internal ID assigned by Streamkap when you create the source or destination. You can find it in the URL when viewing the connector in the Streamkap UI or by using the Quick Actions Menu -> Copy ID action.SQL Server uses a 4-part naming format because it supports multiple databases per connection, requiring the database name as an additional segment.
Custom Topic-to-Table Mapping
Destinations can map topics to custom table names using regex patterns. ThechangeTopicName transform setting allows you to rename topics before they reach the destination, which is useful when you want the destination table name to differ from the default topic-derived name.
Topic Details
Click any topic row to open the Topic Details panel: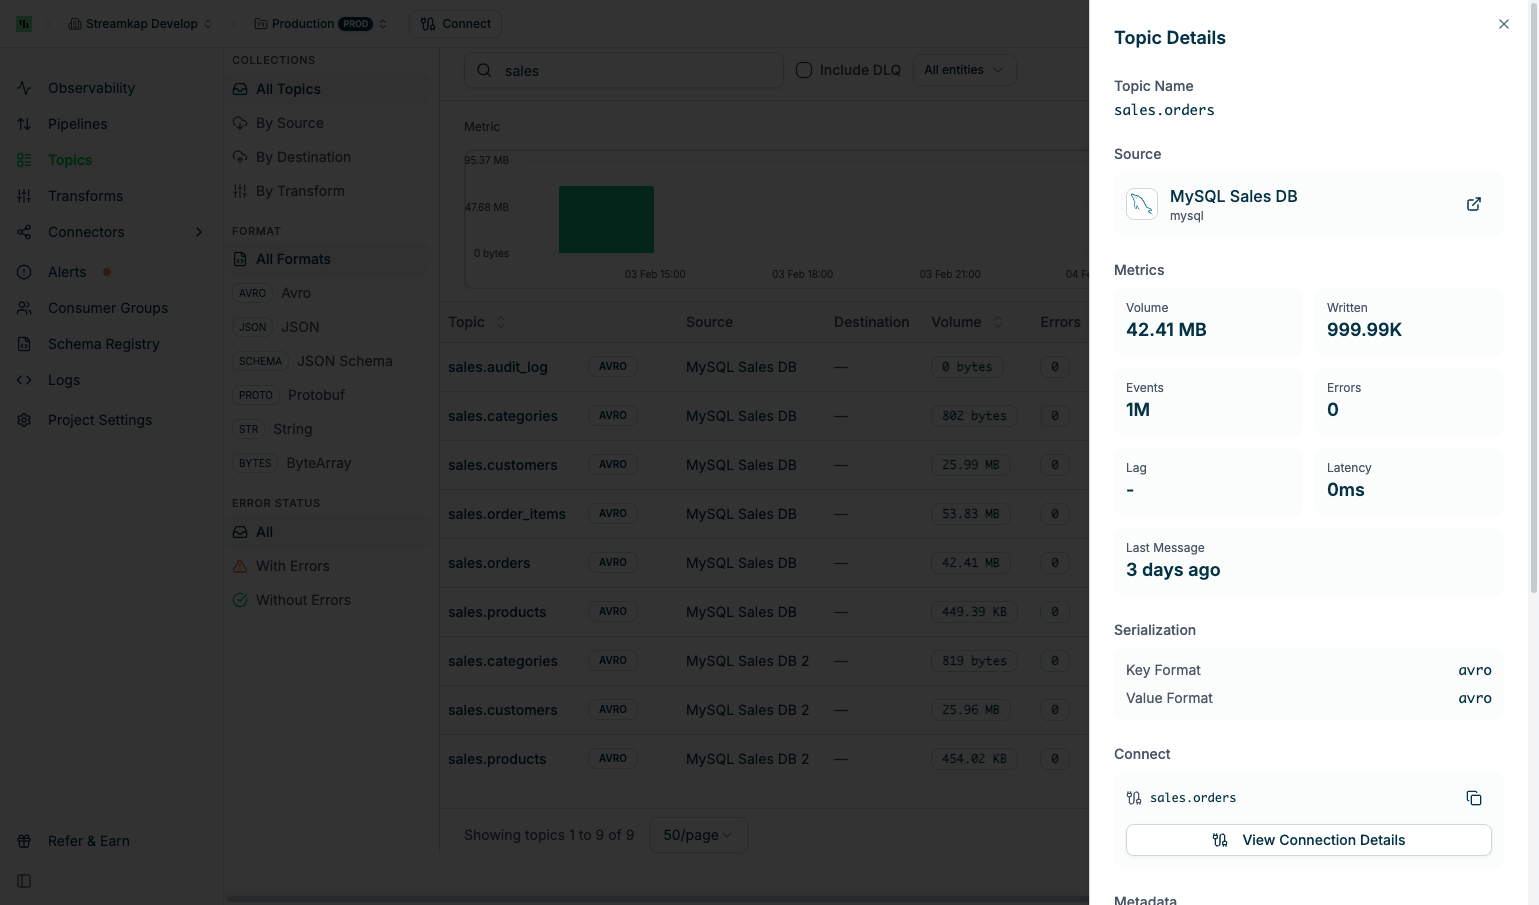
Messages Tab
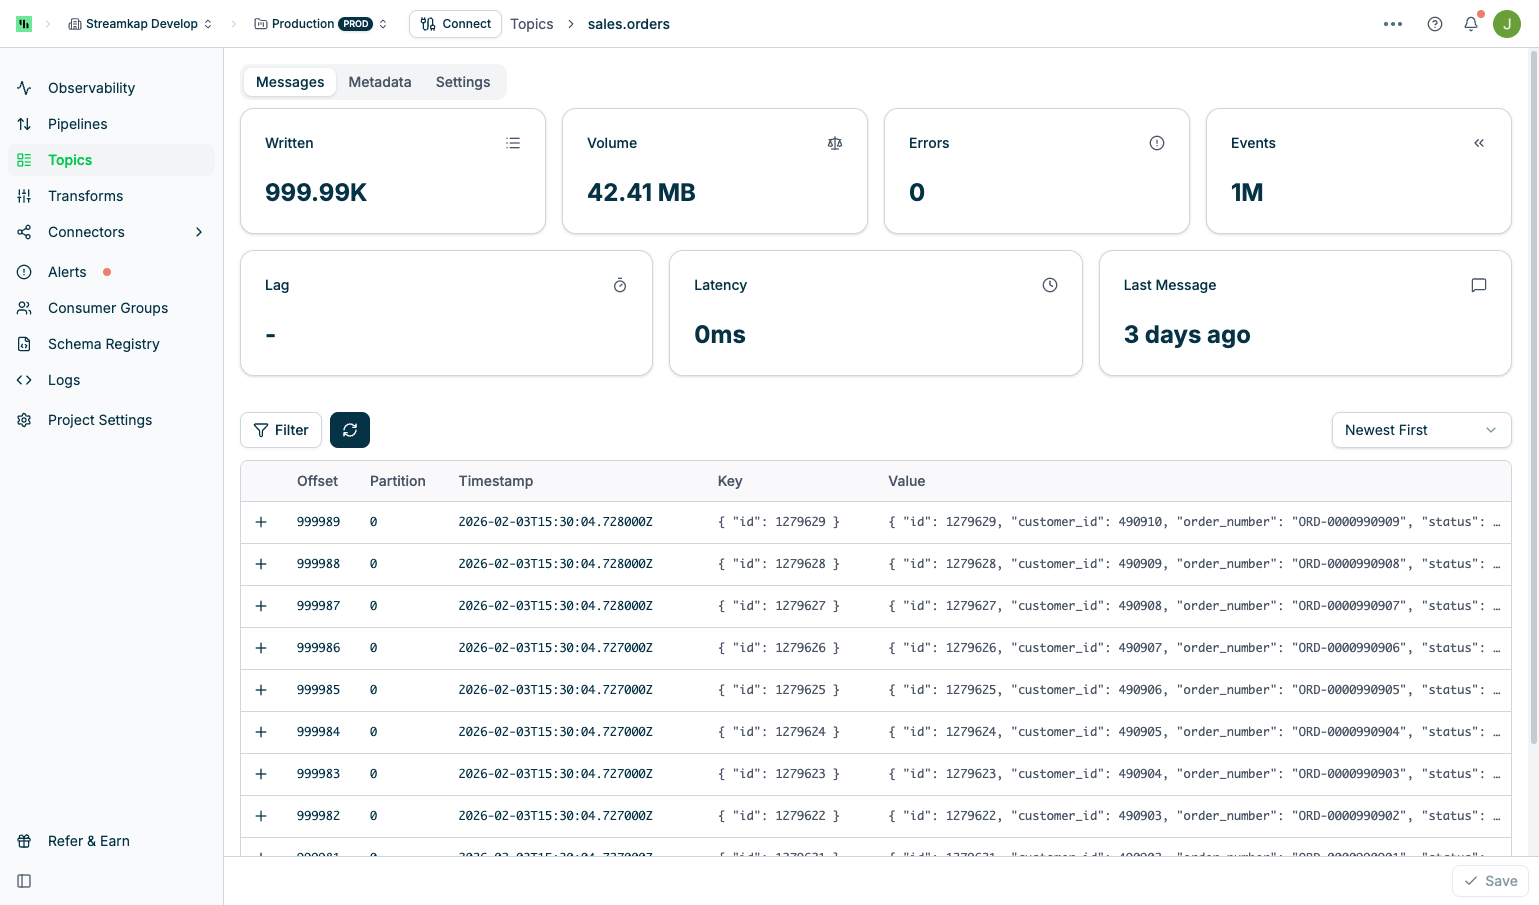
- Filter: Apply seek or regex filters (see Filtering Messages)
- Refresh Button: Reload messages from Kafka
- Sort Order: Toggle between “Oldest First” and “Newest First”
Dead letter queue topics are typically empty unless messages have failed processing and been sent to the DLQ.
Metadata Tab
The Metadata tab displays comprehensive Kafka topic configuration and health information: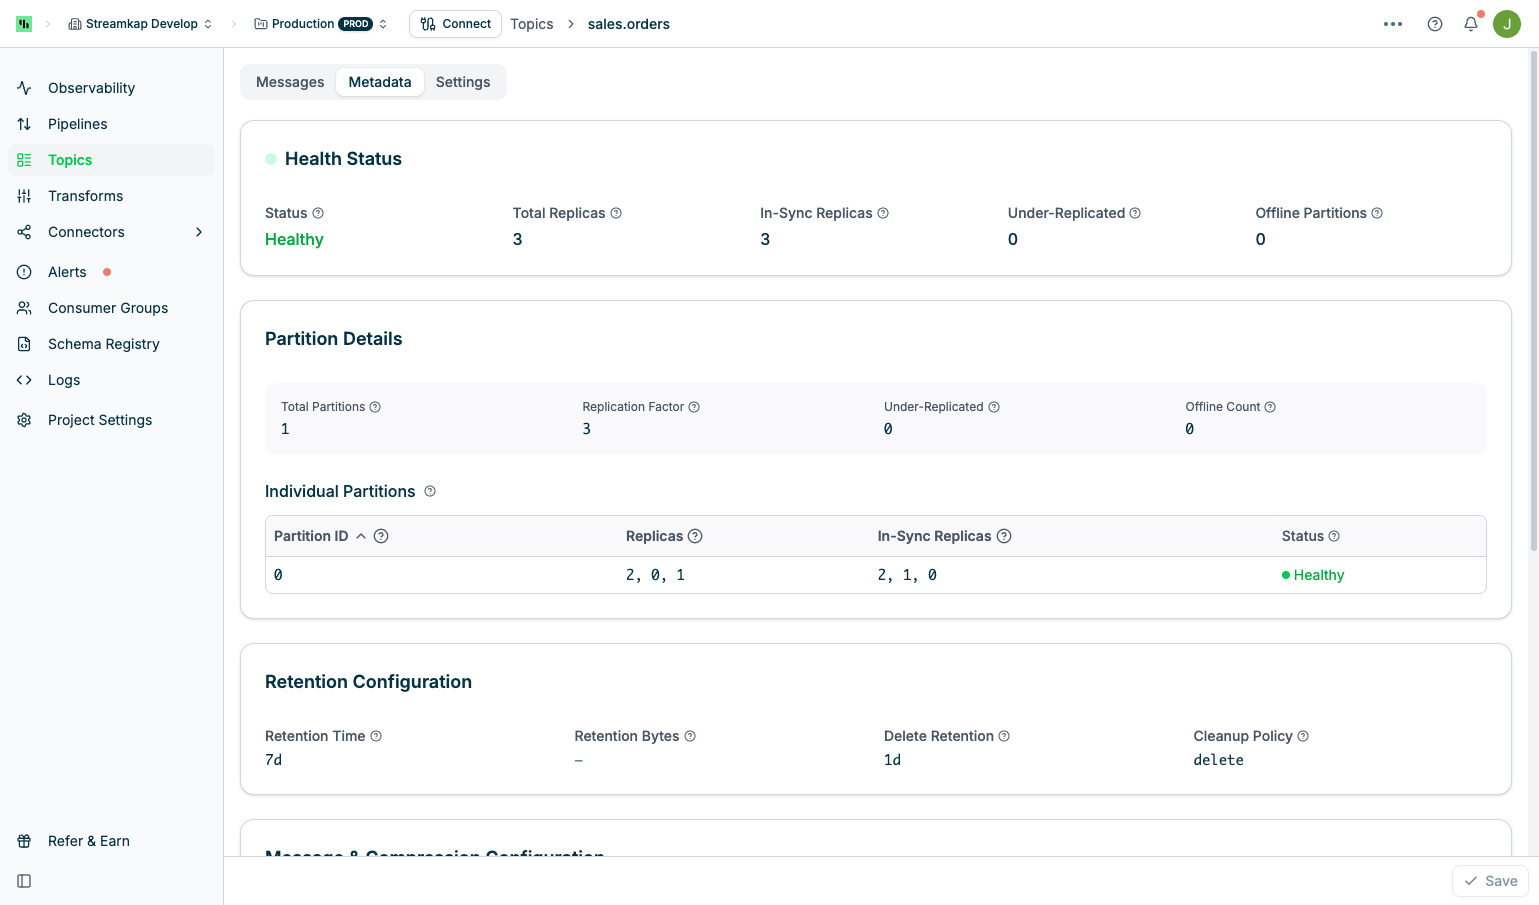
Health Status
Health Status
Monitor the overall health and replication status of your topic:
- Status: Overall topic health (Healthy, Degraded, or Unhealthy)
- Total Replicas: Total number of replicas across all partitions
- In-Sync Replicas: Number of replicas that are caught up with the leader
- Under-Replicated: Number of replicas that are lagging behind the leader
- Offline Partitions: Number of partitions without an active leader
A healthy topic should have all replicas in-sync (In-Sync Replicas = Total Replicas) and zero under-replicated or offline partitions.
Partition Details
Partition Details
View partition-level configuration and status:
- Total Partitions: Number of partitions in the topic
- Replication Factor: Number of replicas for each partition
- Under-Replicated: Count of under-replicated partitions
- Offline Count: Count of offline partitions
Retention Configuration
Retention Configuration
Control how long Kafka retains messages:
- Retention Time: Time-based retention (e.g.,
7dfor 7 days,-1for unlimited) - Retention Bytes: Size-based retention per partition (in bytes,
-1for unlimited) - Delete Retention: Time to retain delete markers for log compaction
- Cleanup Policy: Message cleanup strategy (
delete,compact, ordelete,compact)
Message & Compression Configuration
Message & Compression Configuration
View message handling and compression settings:
- Max Message Size: Maximum size of a single message (default: 64 MB)
- Compression Type: Compression algorithm (
lz4,gzip,snappy,zstd, ornone) - Min In-Sync Replicas: Minimum replicas that must acknowledge writes for success
- Timestamp Type: Source of message timestamps (
CreateTimeorLogAppendTime)
Segment & Other Configuration
Segment & Other Configuration
Segment Configuration:
- Segment Time: Maximum time before creating a new log segment (e.g.,
1h) - Segment Size: Maximum size of a log segment before rolling (e.g.,
1024 MB)
- Unclean Leader Election: Whether to allow out-of-sync replicas to become leaders (
trueprioritizes availability with data loss risk,falseprioritizes durability)
Smaller segments enable finer-grained retention and compaction but increase overhead. For high-throughput CDC topics, segment times of 1 hour and sizes around 1 GB are typical.
Settings Tab
The Settings tab provides partition configuration management: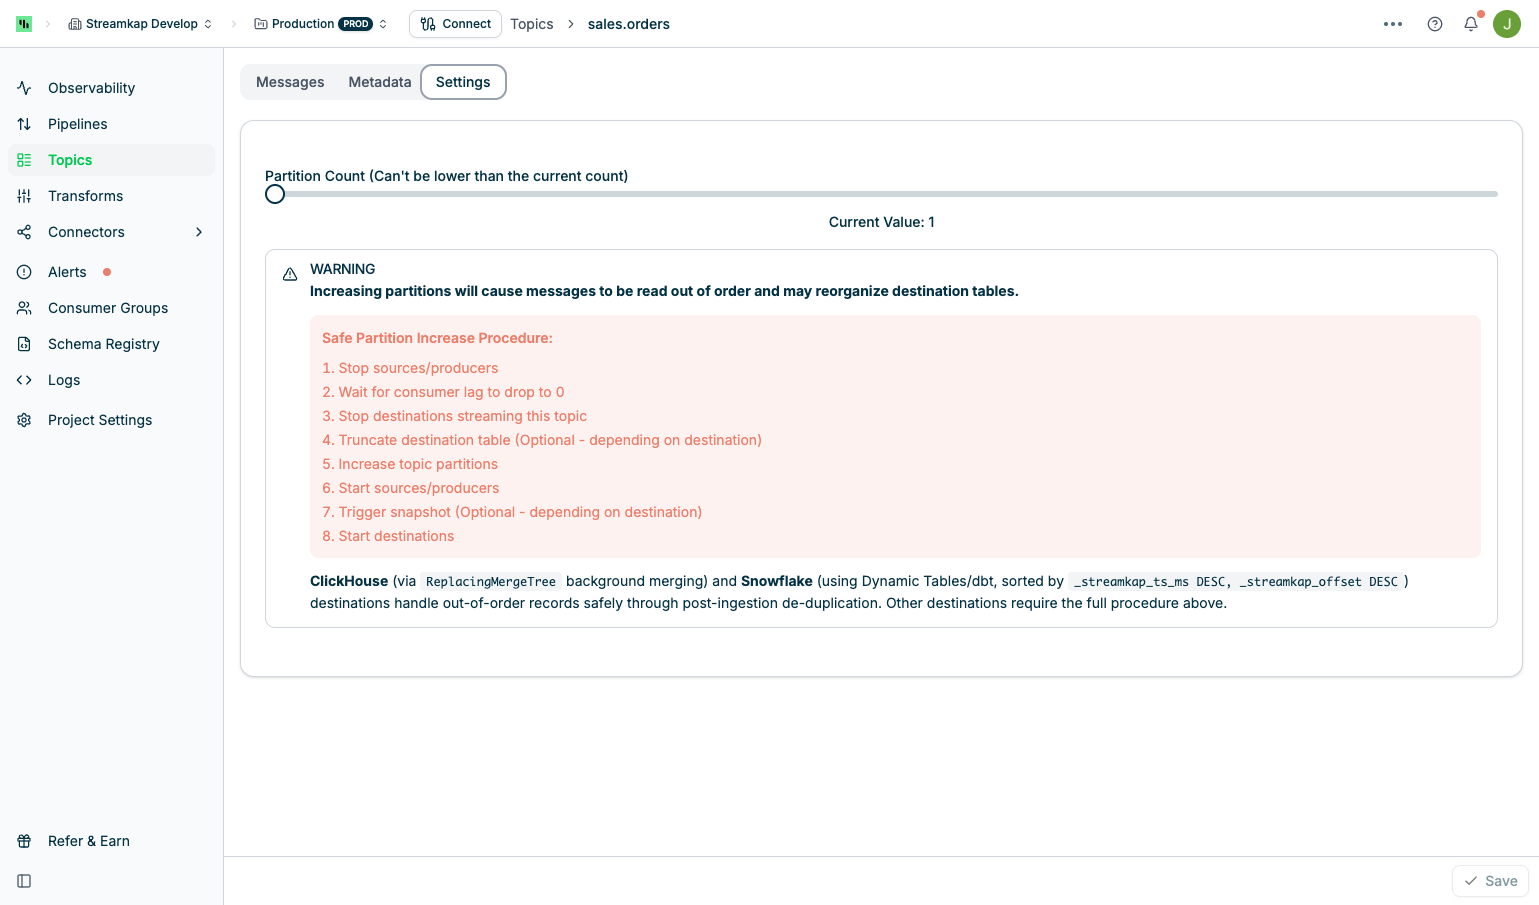
- Slider Control: Drag to increase partition count
- Current Value Display: Shows the active partition count
- Minimum Value: Cannot be lower than current count (Kafka limitation)
- Save Button: Apply partition changes
Filtering Messages
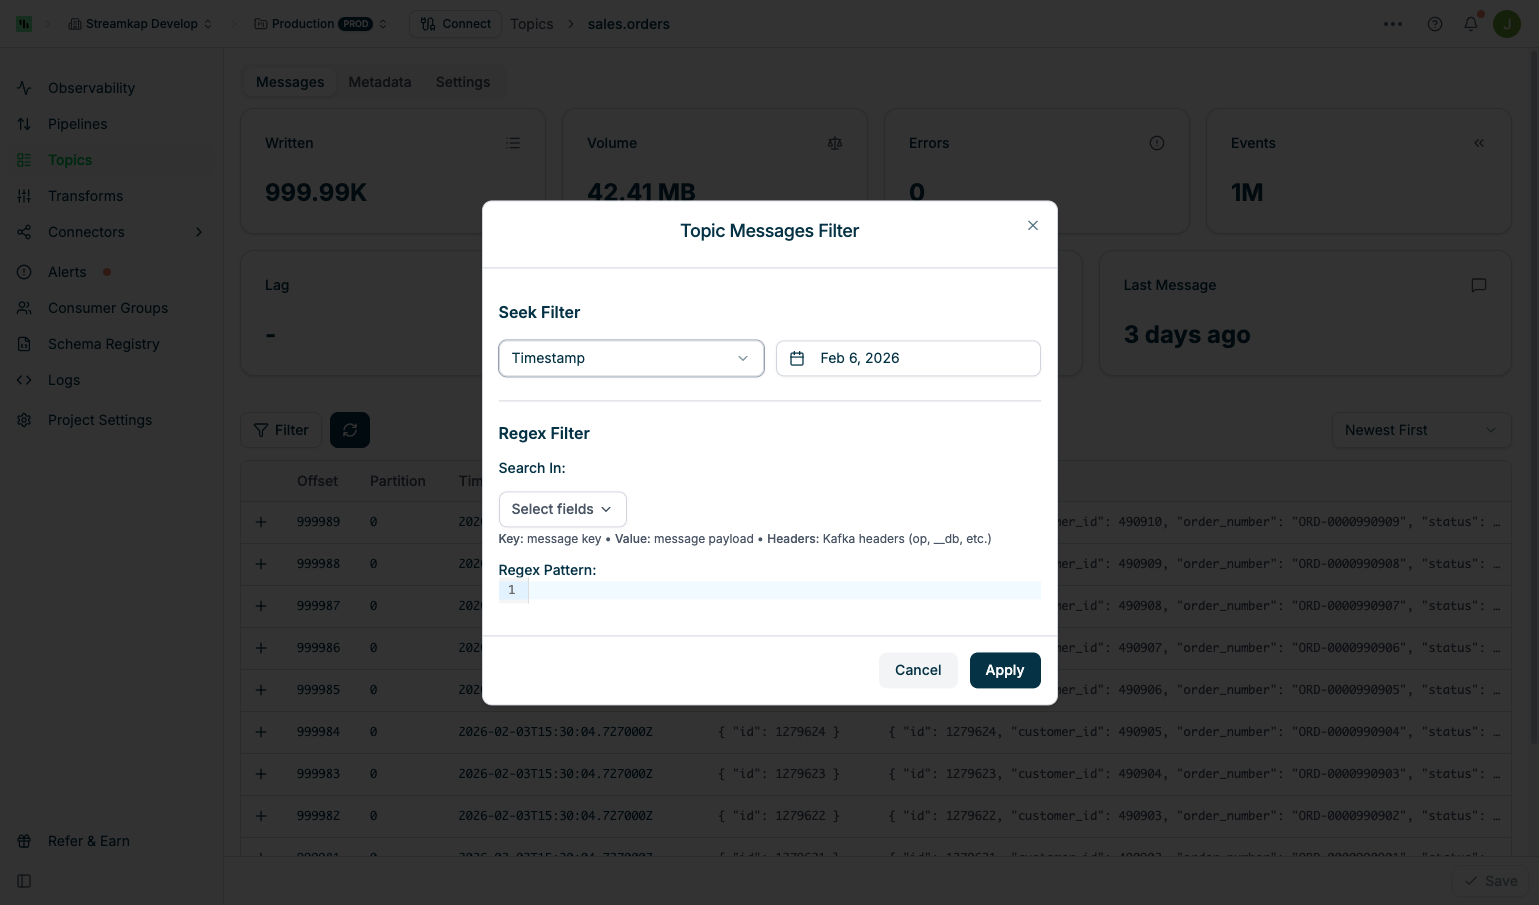
The Filter Messages feature allows you to navigate to specific positions in the topic or search for messages matching patterns. Click the Filter button to open the filter dialog.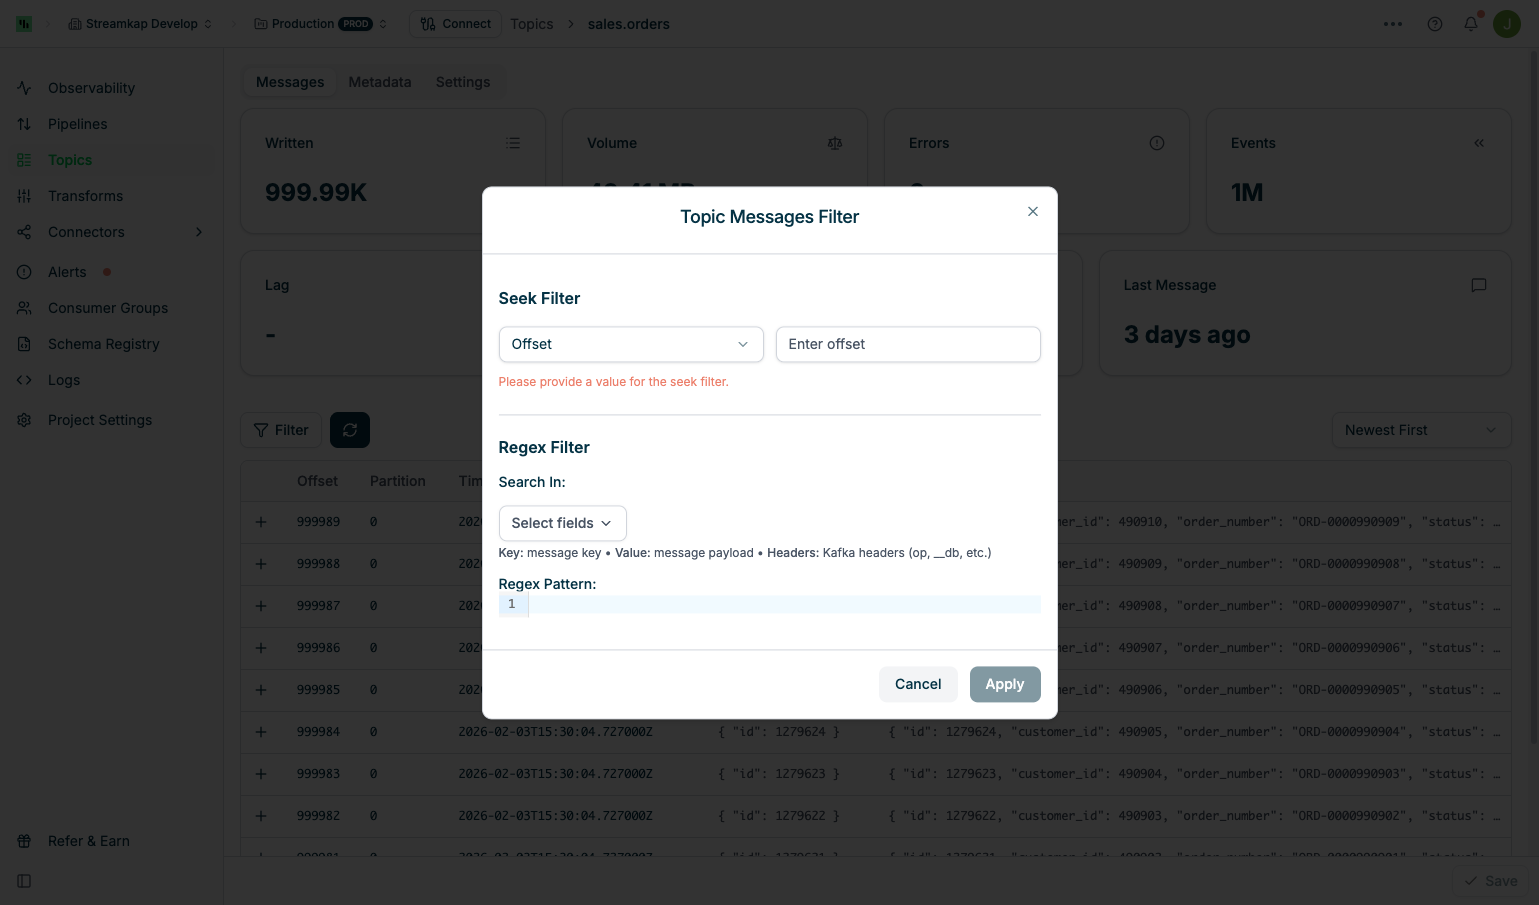
Seek Filter
Seek Filter
Jump to a specific position in the topic:Offset Seek: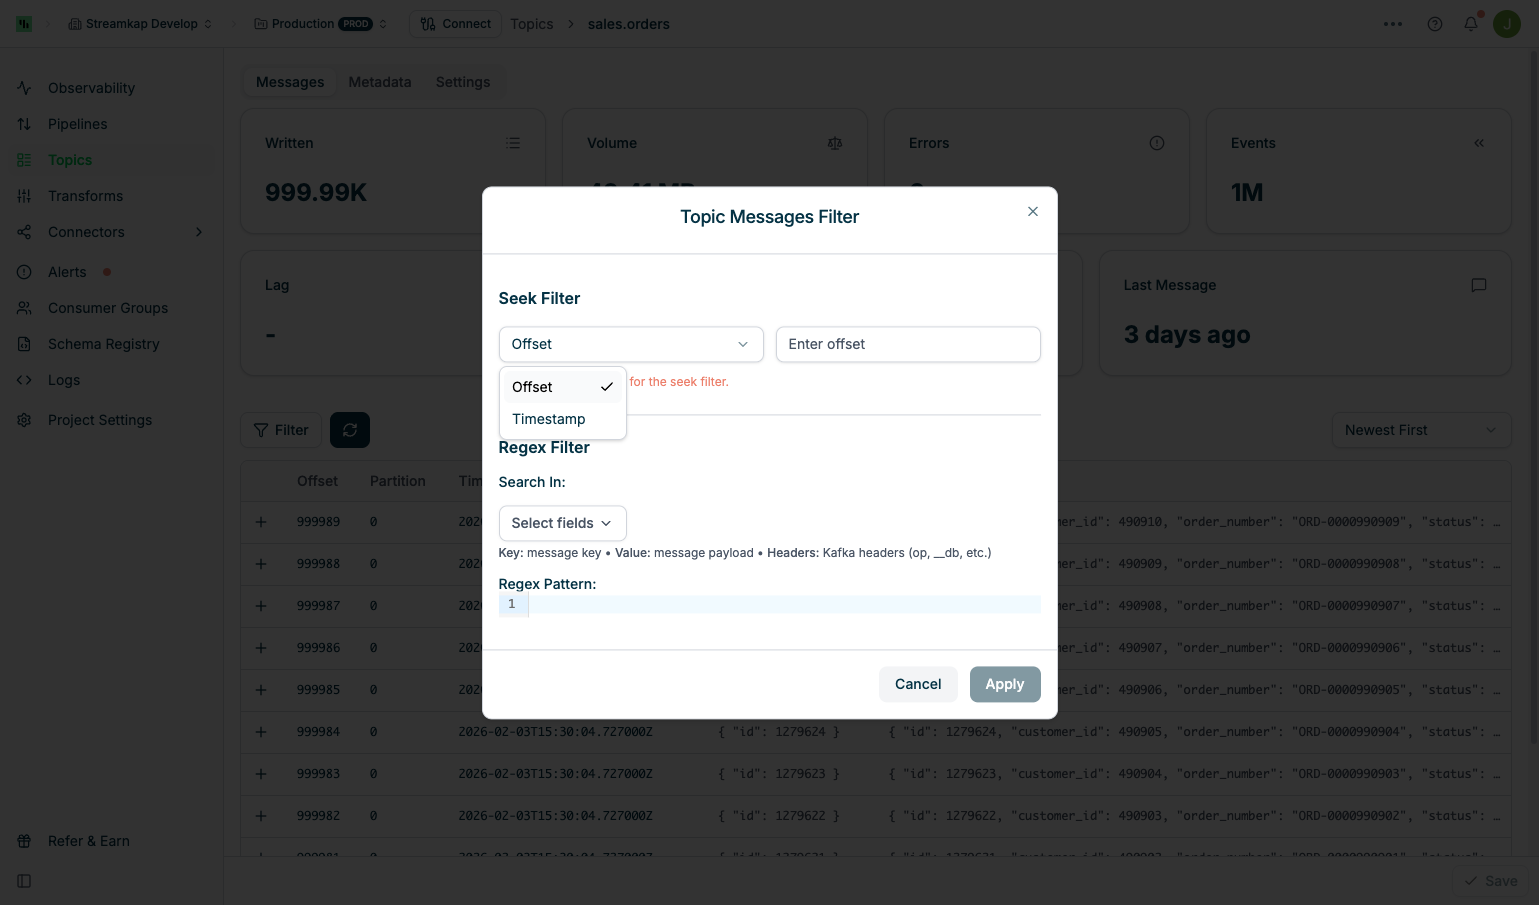
- Select Offset from the dropdown and enter a numeric offset value
- Useful for investigating specific message sequences or resuming from a known position
- Select Timestamp from the dropdown and choose a date/time
- Jumps to the first message at or after the selected timestamp
Seek filters navigate to a position in the topic but do not filter out messages. All messages from that position onward will be displayed.
Regex Filter
Regex Filter
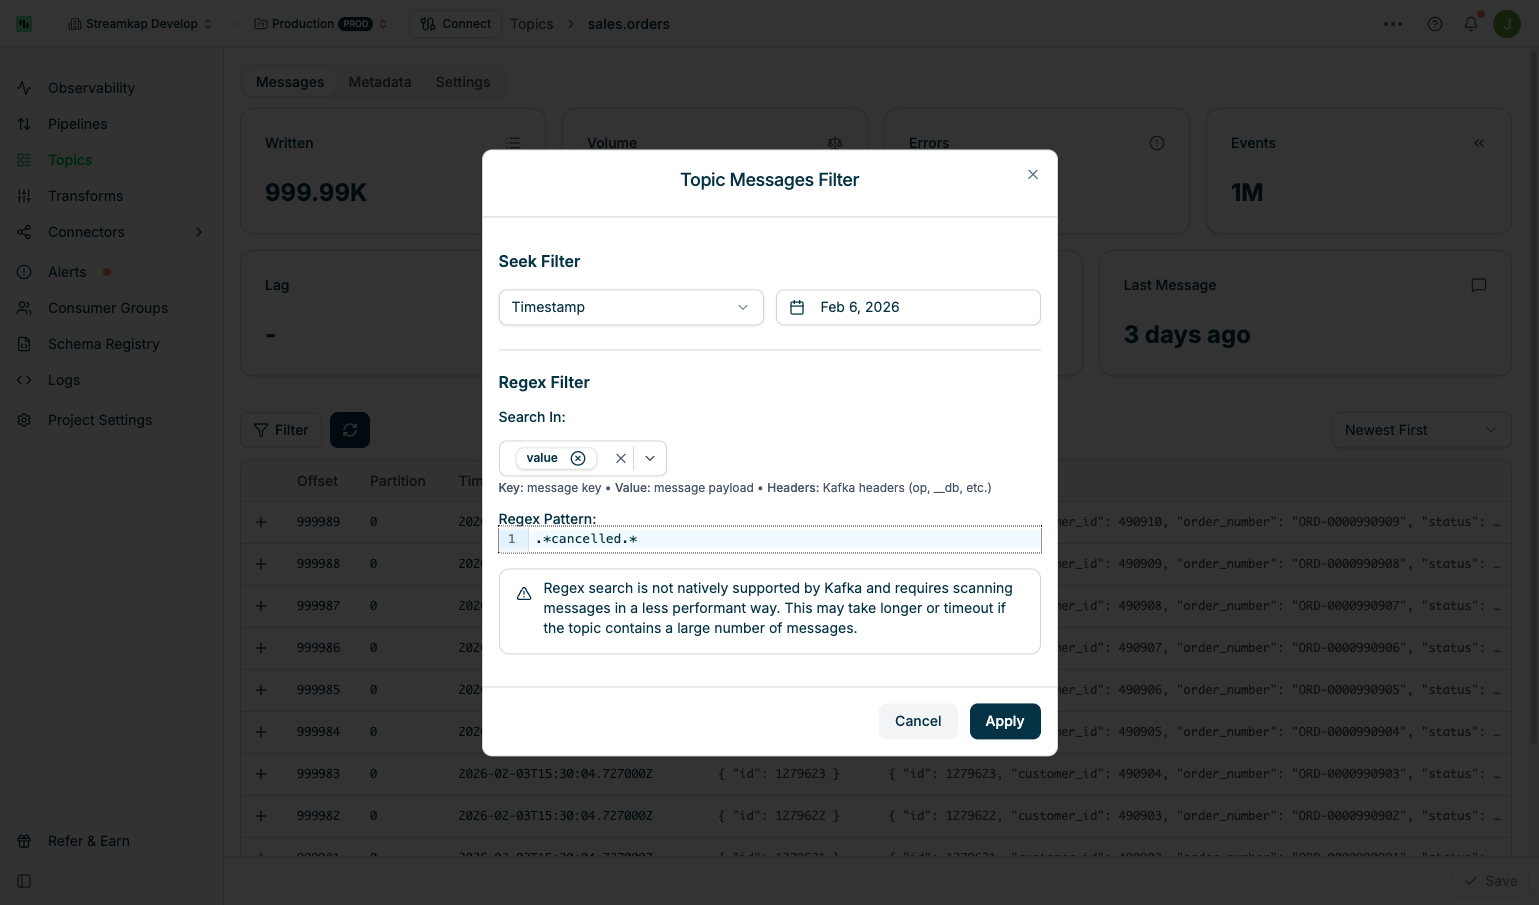
Search for messages matching a regular expression pattern:Search In - Select which message fields to search: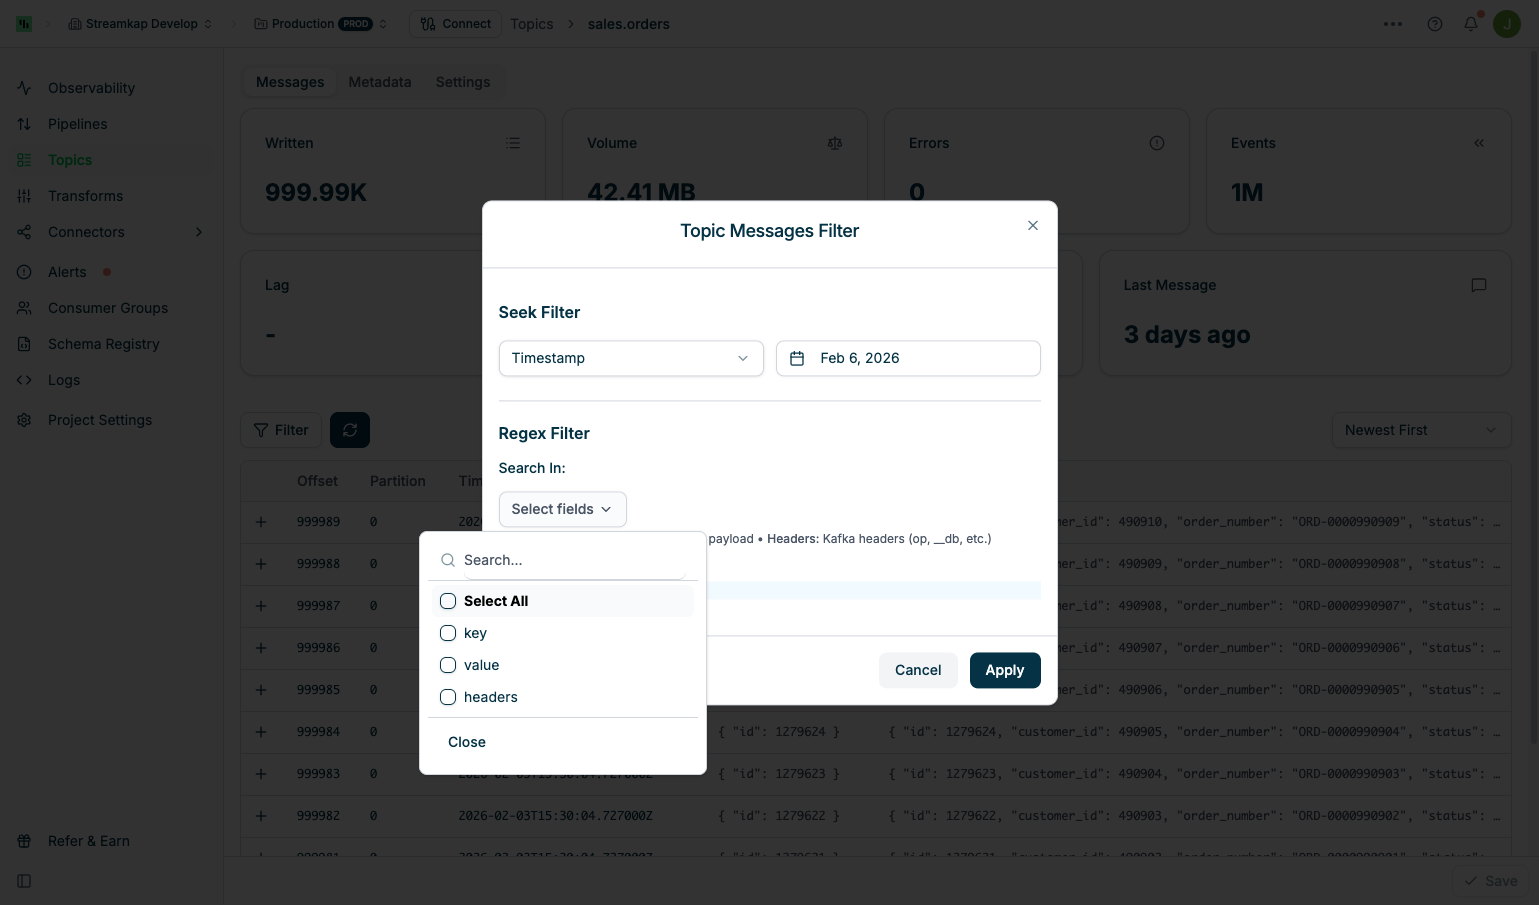
- key: Search in message keys only
- value: Search in message payload only
- headers: Search in Kafka headers (op, __db, etc.)
- Select All: Search in all fields
.*cancelled.*):Applying & Managing Filters
Applying & Managing Filters
Apply Filter:
- Configure your desired Seek Filter and/or Regex Filter
- Click Apply to activate the filter
- A “Filter applied” badge appears with filter management buttons
- Click the X button next to “Filter applied” to clear all active filters
- Removing the filter returns to the default view
- Seek Only: Navigate to a position without filtering messages
- Regex Only: Search from the beginning of the topic
- Seek + Regex: Navigate to a position, then search from there (recommended for large topics)
Partition Management
When to Increase Partitions
Consider increasing partitions when:- Throughput bottlenecks: Single partition cannot handle message volume
- Parallelism needed: Want multiple consumers to process messages concurrently
- Scaling destinations: Destination can benefit from parallel writes
- Faster snapshots/backfills: More partitions allow the destination to write snapshot data in parallel (must also increase destination tasks to match). See Topic Partitioning for details.
Safe Partition Increase Procedure
Safe Partition Increase Procedure
Follow this 8-step procedure to safely increase partitions:
1
Stop sources/producers
Pause all source connectors writing to this topic to prevent new messages.
2
Wait for consumer lag to drop to 0
Ensure all in-flight messages have been consumed and processed.
3
Stop destinations streaming this topic
Pause destination connectors consuming from this topic.
4
Truncate destination table (Optional)
For most destinations, truncate the target table to prepare for potential re-ingestion.Skip this step if using ClickHouse or Snowflake.
5
Increase topic partitions
Use the Settings tab slider to increase the partition count and click Save.
6
Start sources/producers
Resume source connectors to begin writing messages to the new partition layout.
7
Trigger snapshot (Optional)
For some destinations, trigger a snapshot to re-sync data.Skip this step if using ClickHouse or Snowflake.
8
Start destinations
Resume destination connectors to consume messages from all partitions.
Destination-Specific Handling
Destination-Specific Handling
ClickHouse:
- Uses
ReplacingMergeTreeengine with background merging - Handles out-of-order records automatically through de-duplication
- Does not require table truncation or snapshot triggering
- Uses Dynamic Tables or dbt with sorting by
_streamkap_ts_ms DESC, _streamkap_offset DESC - Post-ingestion de-duplication handles out-of-order records
- Does not require table truncation or snapshot triggering
- Require the full 8-step procedure to maintain data consistency
Performance Tuning
Performance Tuning
If you are experiencing performance issues or lag with your topics, adjustments to poll records, partition counts, and task parallelism can help. See Performance Tuning for detailed guidance on optimizing pipeline throughput and latency.
Troubleshooting
Topic Not Appearing in List
Topic Not Appearing in List
- Check Connector Status: Ensure the source or destination connector is running
- Verify Topic Creation: Some topics are created only after first message write
- Refresh the Page: Click the refresh button to reload the topic list
- Check Kafka: Use Kafka Access to verify the topic exists in Kafka directly
High Error Count
High Error Count
- Inspect DLQ Messages: Navigate to the dead letter queue topic and review failed messages
- Check Pipeline Logs: Review logs for the associated pipeline (Logs)
- Review Destination Settings: Verify destination schema and configuration
- Check for Alerts: Review alerts for this topic and associated connectors (Alerts)
- Validate Schema: Ensure source schema matches destination expectations
Partition Increase Not Taking Effect
Partition Increase Not Taking Effect
- Check Save Button: Ensure you clicked Save after adjusting the slider
- Verify Kafka State: Use Kafka Access to confirm partition count in Kafka
- Review Logs: Check project logs for partition update errors
- Kafka Limitations: Remember that partition count can only increase, never decrease
- Wait for Propagation: Some changes may take a few moments to reflect in the UI
Messages Not Appearing in Browser
Messages Not Appearing in Browser
- Check Time Range: Ensure messages exist in the displayed time range
- Verify Message Production: Confirm the source is actively writing messages
- Check Partition Filter: Remove any partition filters that may be hiding messages
- Refresh Data: Click the refresh button to reload messages from Kafka
- Inspect Kafka Directly: Use Kafka Access to verify messages exist in the topic
Best Practices
Best Practices
- Monitor DLQ Topics: Set up alerts for dead letter queue activity to catch processing failures quickly
- Plan Partition Changes: Schedule partition increases during maintenance windows when data pipelines can be paused
- Use Appropriate Partition Counts: Start with fewer partitions and scale up based on throughput needs
- Inspect Failed Messages: Regularly review DLQ topics to identify recurring issues
- Document Partition Changes: Record partition increase operations and their impact on downstream systems
- Test Before Scaling: If possible, test partition increases in a non-production environment first
- Monitor Topic Metrics: Regularly check topic metrics to detect lag or errors early