

Dashboard
View the Streamkap dashboard for pipeline, connector, topic, and transform counts, plus time-series charts of volume, events, errors, and latency.
The Dashboard provides a high-level overview of your Streamkap project, displaying entity counts, status summaries, and time-series metrics for your data pipelines.
Overview
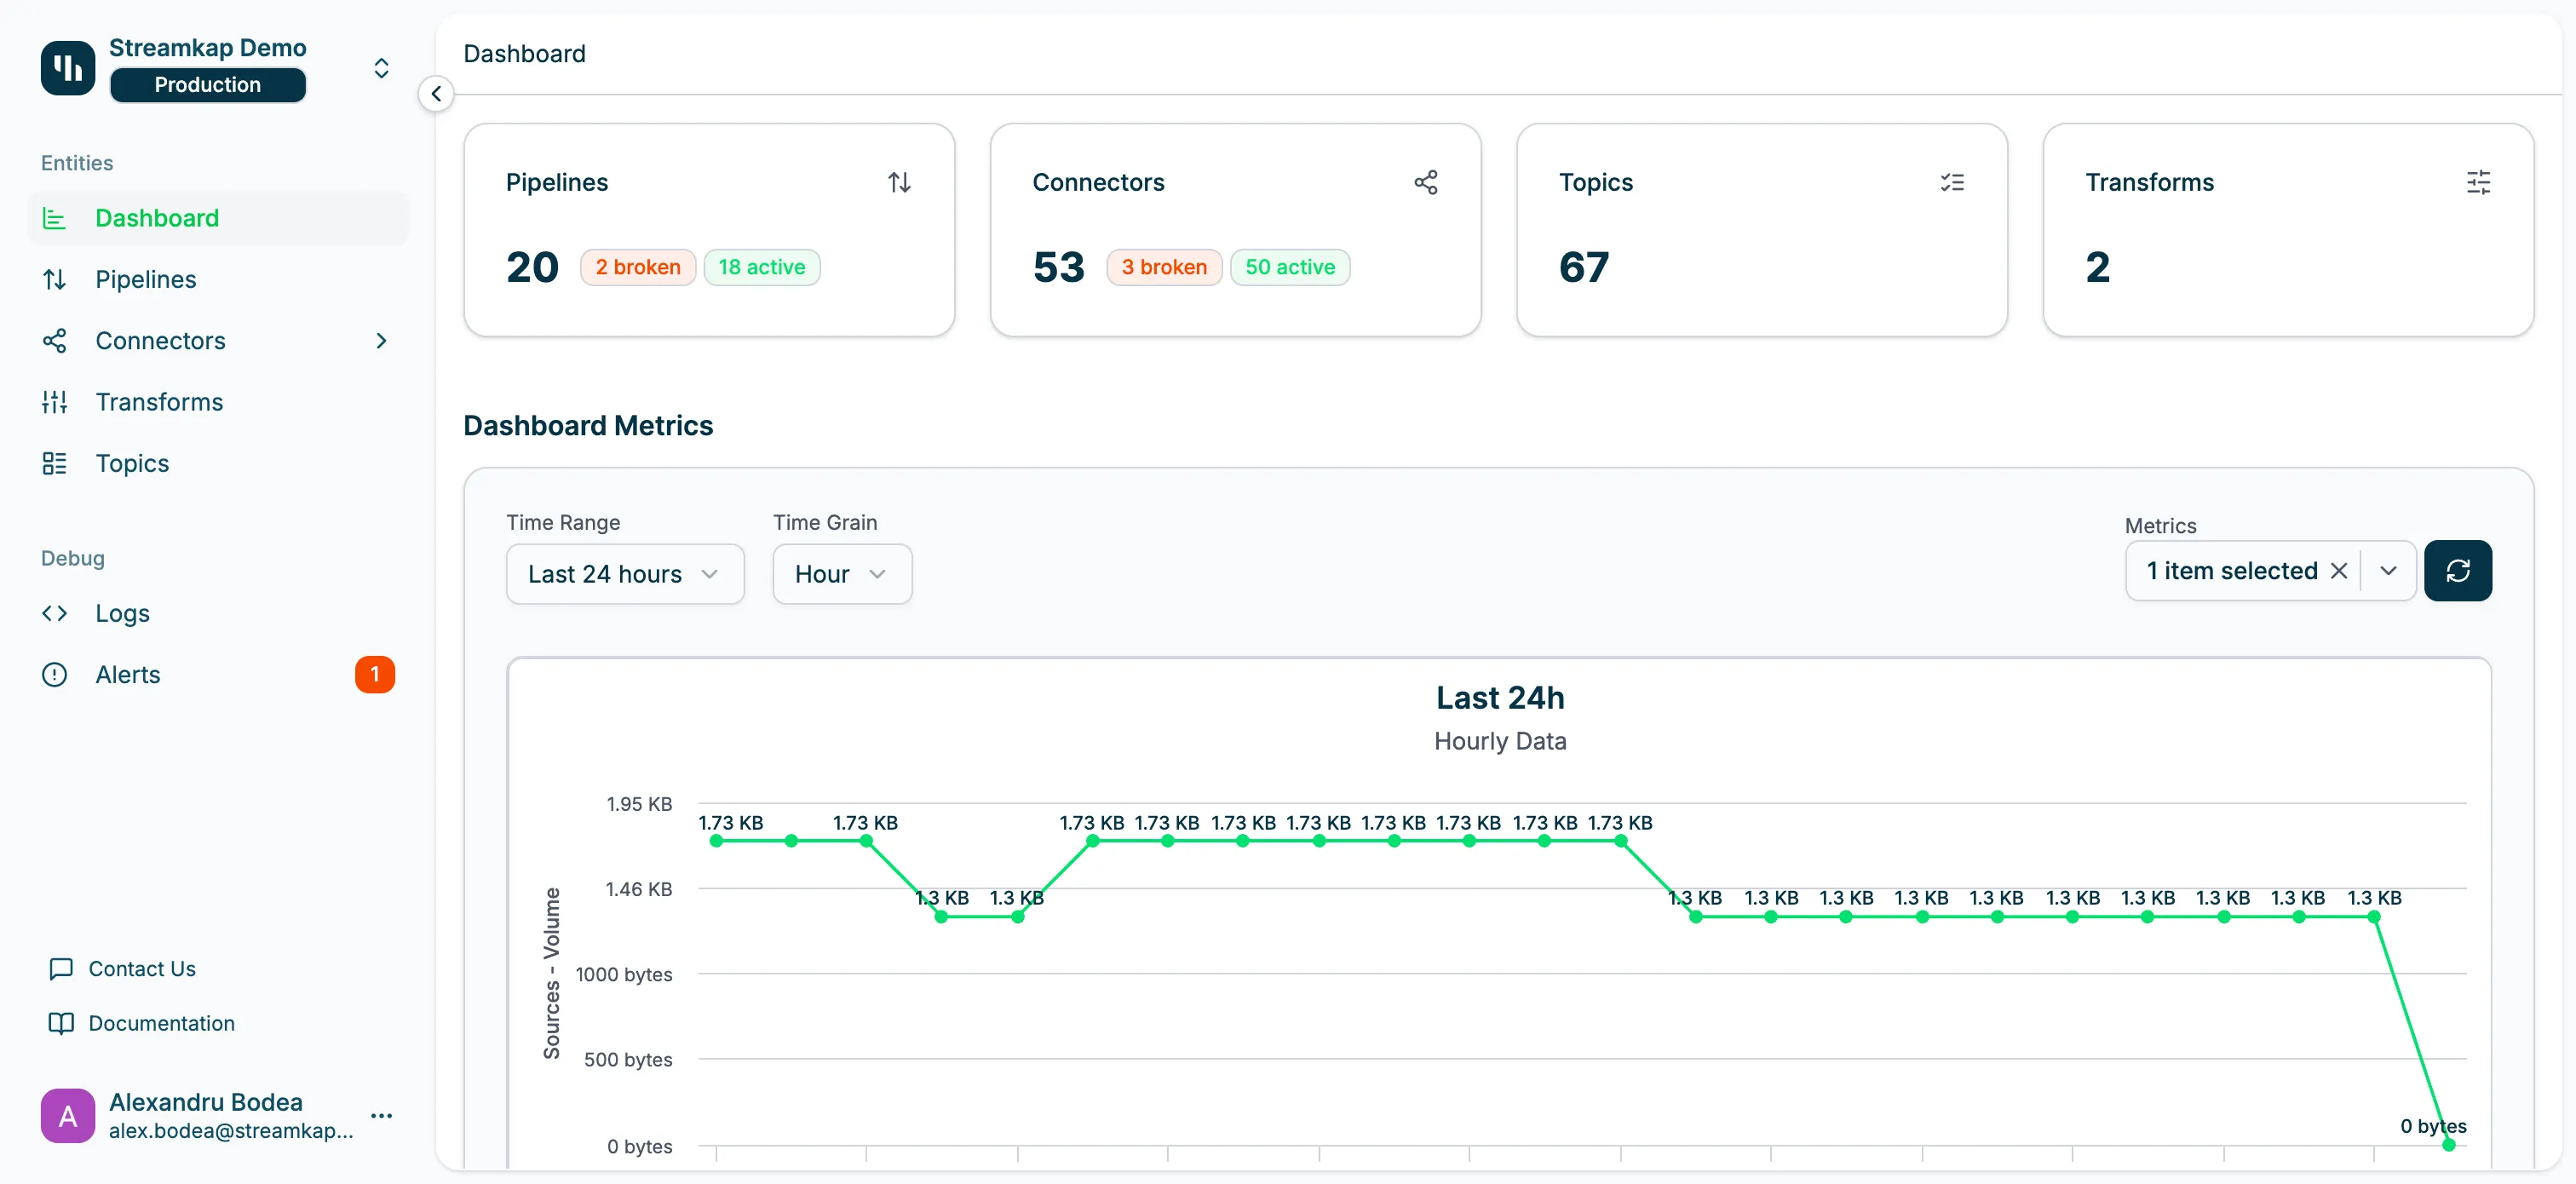
The Dashboard is the landing page after logging in and switching to a project. It displays aggregate metrics and charts to help you quickly assess the health of your CDC infrastructure.
Overview Cards
Four metric cards provide instant visibility into your project entities:
Pipelines
Displays the total number of data pipelines and their status breakdown:
- Total Count: Total number of pipelines in the project
- Broken: Number of pipelines with failed or stopped connectors
- Active: Number of pipelines with healthy, running connectors
- Click Action: Navigate to the Pipelines page
Connectors
Shows the aggregate count of source and destination connectors:
- Total Count: Combined count of all source and destination connectors
- Broken: Number of connectors in FAILED or STOPPED state
- Active: Number of connectors in RUNNING state
- Click Action: Navigate to Sources or Destinations via the Connectors menu in the sidebar
Topics
Displays Kafka topic statistics:
- Total Count: Number of Kafka topics in the project
- Includes both data topics and dead letter queue topics
- Click Action: Navigate to the Topics page
Transforms
Shows streaming transform statistics:
- Total Count: Number of active Apache Flink transforms
- Includes all transform types (Filter, Aggregate, Join, Enrich)
- Click Action: Navigate to the Transforms page
Dashboard Metrics Chart
The time-series chart visualizes key metrics over configurable time ranges:
Time Range Selection
Choose the time window for metrics display:
- Last 1 Hour: Real-time monitoring for active troubleshooting
- Last 24 Hours: Daily operational overview
- Last 7 Days: Weekly trend analysis
- Last 30 Days: Monthly performance review
- Custom Range: Select specific start and end dates
Time Grain Selection
Adjust the data aggregation granularity:
- 1 Minute: Fine-grained resolution for recent data (available for short time ranges)
- 5 Minutes: Balance between detail and chart readability
- 1 Hour: Hourly aggregates for daily/weekly views
- 1 Day: Daily aggregates for monthly trends
Metrics Selection
Toggle between different metric types:
Volume Metrics:
- Inbound Volume: Data flowing from sources into Kafka (MB/GB/TB)
- Outbound Volume: Data flowing from Kafka to destinations (MB/GB/TB)
Event Metrics:
- Events Processed: Total number of CDC events/messages processed
Error Metrics:
- Errors: Count of failed messages sent to dead letter queues
Performance Metrics:
- Latency: Average end-to-end pipeline processing latency (ms)
Chart Interactions
- Hover Tooltips: View exact metric values at specific time points
- Legend: Click metric names to show/hide specific series
- Zoom: Drag to select a time range for closer inspection (if supported)
- Refresh: Metrics update automatically every 30 seconds
Use Cases
Operational Monitoring
Check the Dashboard regularly to:
- Verify Project Health: All overview cards show green status
- Detect Anomalies: Sudden spikes or drops in volume/events
- Monitor Broken Entities: Identify and investigate failed pipelines/connectors
- Track Processing Rate: Ensure events are flowing consistently
Troubleshooting
When investigating issues:
- Check Broken Count: Start with overview cards to identify affected entities
- Review Metrics Timeline: Identify when issues started using the chart
- Correlate Metrics: Compare volume, errors, and latency for patterns
- Navigate to Details: Click cards to drill down into specific entities
Capacity Planning
Use the Dashboard for capacity insights:
- Track Volume Growth: Review 30-day volume trends
- Identify Peak Hours: Analyze hourly/daily patterns
- Monitor Latency: Ensure processing keeps up with ingestion
- Plan Scaling: Use metrics to inform partition and task scaling decisions
Best Practices
- Set as Default View: Keep the Dashboard as your landing page for quick health checks
- Monitor Regularly: Check the Dashboard at the start of each work session
- Set Up Alerts: Configure Alerts for broken pipelines and connectors
- Review Trends: Regularly review weekly/monthly metrics for capacity planning
- Investigate Broken Entities: Address broken pipelines/connectors promptly to prevent data lag
- Correlate with Logs: Use the Dashboard to identify issues, then check Logs for details
- Track After Changes: Monitor the Dashboard after making configuration changes
Understanding Metric Patterns
Normal Patterns
- Steady Volume: Consistent inbound and outbound volume indicates healthy replication
- Low Error Count: Zero or minimal errors in dead letter queues
- Stable Latency: Consistent end-to-end processing times
- Balanced In/Out: Inbound and outbound volume roughly equal (accounting for transforms)
Warning Signs
- Increasing Broken Count: Indicates connector failures requiring investigation
- Volume Drops to Zero: Suggests source connector stopped or paused
- High Error Rate: Schema mismatches or destination issues
- Growing Latency: Processing can’t keep up with ingestion rate
- Outbound < Inbound: Potential destination bottleneck or consumer lag
Troubleshooting
Dashboard Not Loading
If the Dashboard page doesn’t display:
- Check Project State: Verify project is AVAILABLE in Projects
- Refresh Browser: Reload the page (Ctrl+R / Cmd+R)
- Clear Cache: Clear browser cache and cookies
- Check Network: Verify network connectivity
- Try Different Browser: Rule out browser-specific issues
Metrics Not Updating
If metrics appear stale:
- Check Time Range: Ensure selected range includes recent data
- Verify Service Activity: Confirm pipelines are actively processing data
- Refresh Manually: Click refresh button if auto-refresh isn’t working
- Check Project Logs: Review project logs for metric collection issues
- Contact Support: If metrics consistently don’t update
Broken Count Doesn’t Match Reality
If overview card counts seem incorrect:
- Refresh Dashboard: Reload to get latest entity states
- Check Entity Pages: Navigate to Pipelines/Connectors to verify actual status
- Review Recent Changes: Recent restarts may temporarily show as broken
- Wait for Sync: Status updates may take 1-2 minutes to propagate
- Clear Cache: Browser cache may show stale counts
Related Documentation
- Pipelines - Detailed pipeline configuration and management
- Sources - Source connector configuration and management
- Destinations - Destination connector configuration and management
- Topics - Kafka topic metrics and message inspection
- Transforms - Streaming transformation monitoring
- Alerts - Set up proactive notifications for issues
- Logs - Troubleshoot pipeline and connector issues
- Projects - Switch between projects and manage infrastructure