

Google Analytics 4
Stream Google Analytics 4 reports, realtime data and property configuration into Streamkap with a service-account key from your own Google Cloud project.
The Google Analytics 4 source reads daily, weekly, monthly and realtime reports from one or more GA4 properties, plus the properties’ configuration, into one Kafka topic per report, named source_<id>.google_analytics.<report>.
Prerequisites
- A Google Cloud project where you can enable APIs and create a service account and a JSON key for it.
- Administrator access to each GA4 property, to add the service account as a user.
The service account needs no Google Cloud IAM role. It needs:
- The Google Analytics Data API enabled in its project.
- The Viewer role on every GA4 property the source reads.
- The Google Analytics Admin API enabled in the same project, for the
admin_*metadata resources and for the Property ID picker. Without it, type the property IDs.
Google Cloud Setup
1. Choose the Project
In the Google Cloud console, select the project the service account will live in, or create one.
2. Enable the APIs
- Go to APIs & Services → Library.
- Open Google Analytics Data API and click Enable.
- Do the same for Google Analytics Admin API if you want the
admin_*resources or the property picker.
3. Create a Service Account and a JSON Key
- Go to IAM & Admin → Service accounts and click Create service account.
- Enter a name, for example
streamkap-ga4. Skip the optional role steps and click Done. - Open the service account, go to the Keys tab, and click Add key → Create new key.
- Choose JSON and click Create. The key file downloads.
The key file is a credential for every property the service account can read. Paste it into Streamkap, then delete the downloaded copy or store it with your other secrets. The service account’s email is the key’s client_email, such as streamkap-ga4@<project-id>.iam.gserviceaccount.com.
Google Analytics Setup
1. Add the Service Account to the Property
- In Google Analytics, open the property and click Admin.
- Under Property, open Property access management, click + and choose Add users.
- Enter the service account’s
client_emailand choose the Viewer role. - Leave No Cost Metrics and No Revenue Metrics unchecked. With either restriction GA4 serves the restricted metrics as zeros, so Streamkap refuses any report that asks for one.
- Click Add. Repeat for every property the source reads.
2. Find the Property ID
In Admin → Property details, copy the Property ID, a number such as 123456789. It is not a web stream’s Measurement ID (G-…), which Streamkap rejects.
Streamkap Setup
1. Create the Source
- Navigate to Add Connectors.
- Choose Google Analytics 4.
2. Connection Settings (Auth Tab)
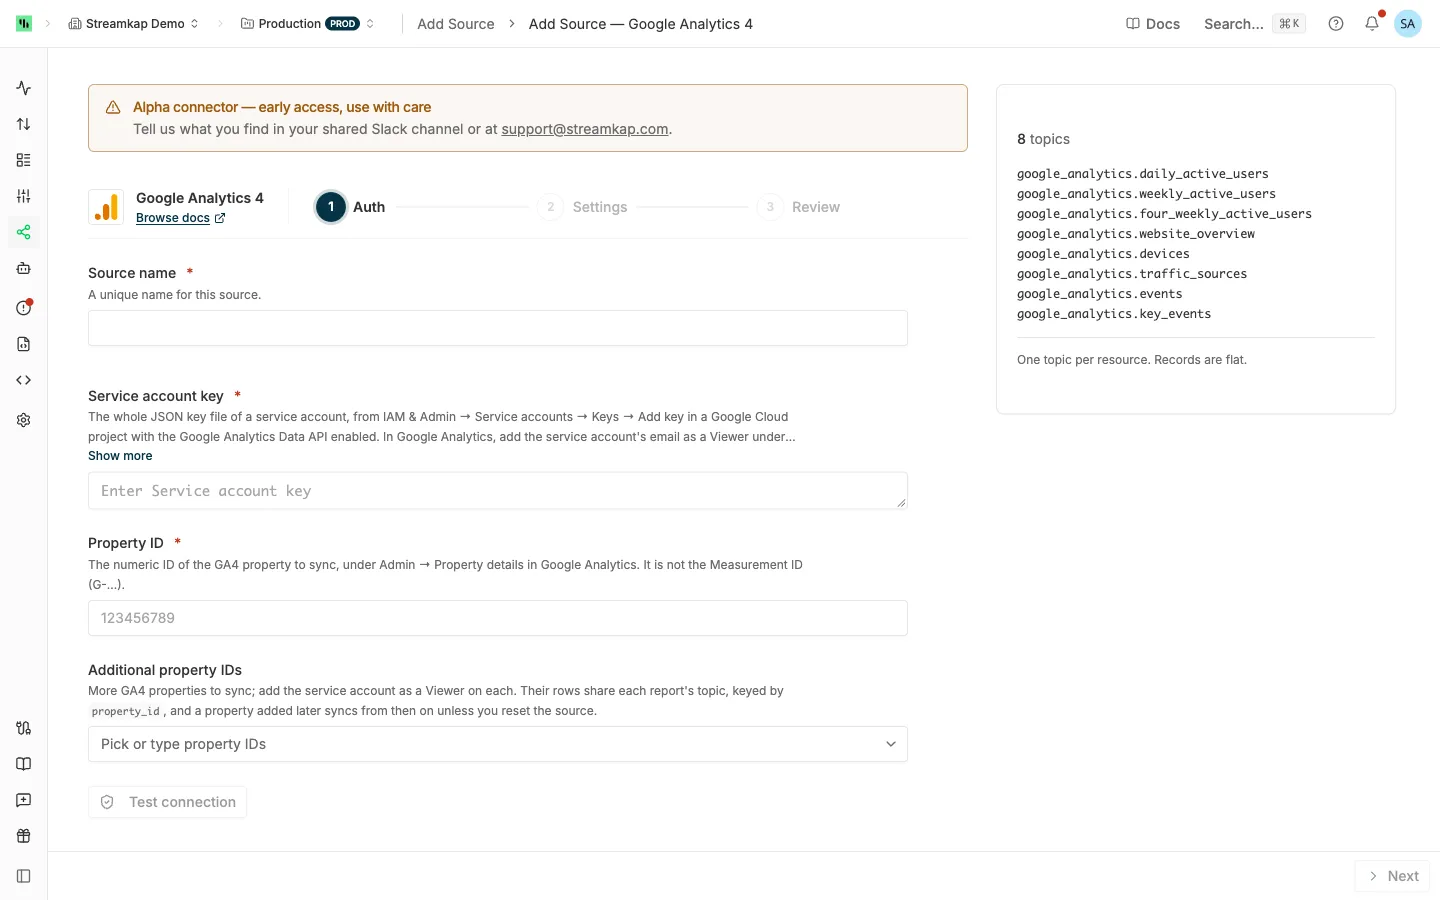
- Source name: A unique name for this source, for example
ga4-web. - Service account key: The whole JSON key file, from
{to}. - Property ID: The numeric ID of the GA4 property to sync. Once the key is in, the field lists the properties the key can read, by name; pick one or type the ID.
- Additional property IDs (optional): More properties to sync with the same key; add the service account as a Viewer on each. All properties share one topic per report, and each row carries its
property_id.
Click Test connection to check the key, the Data API and access to each property. See Test connection and Test access. Click Next.
3. Settings Tab
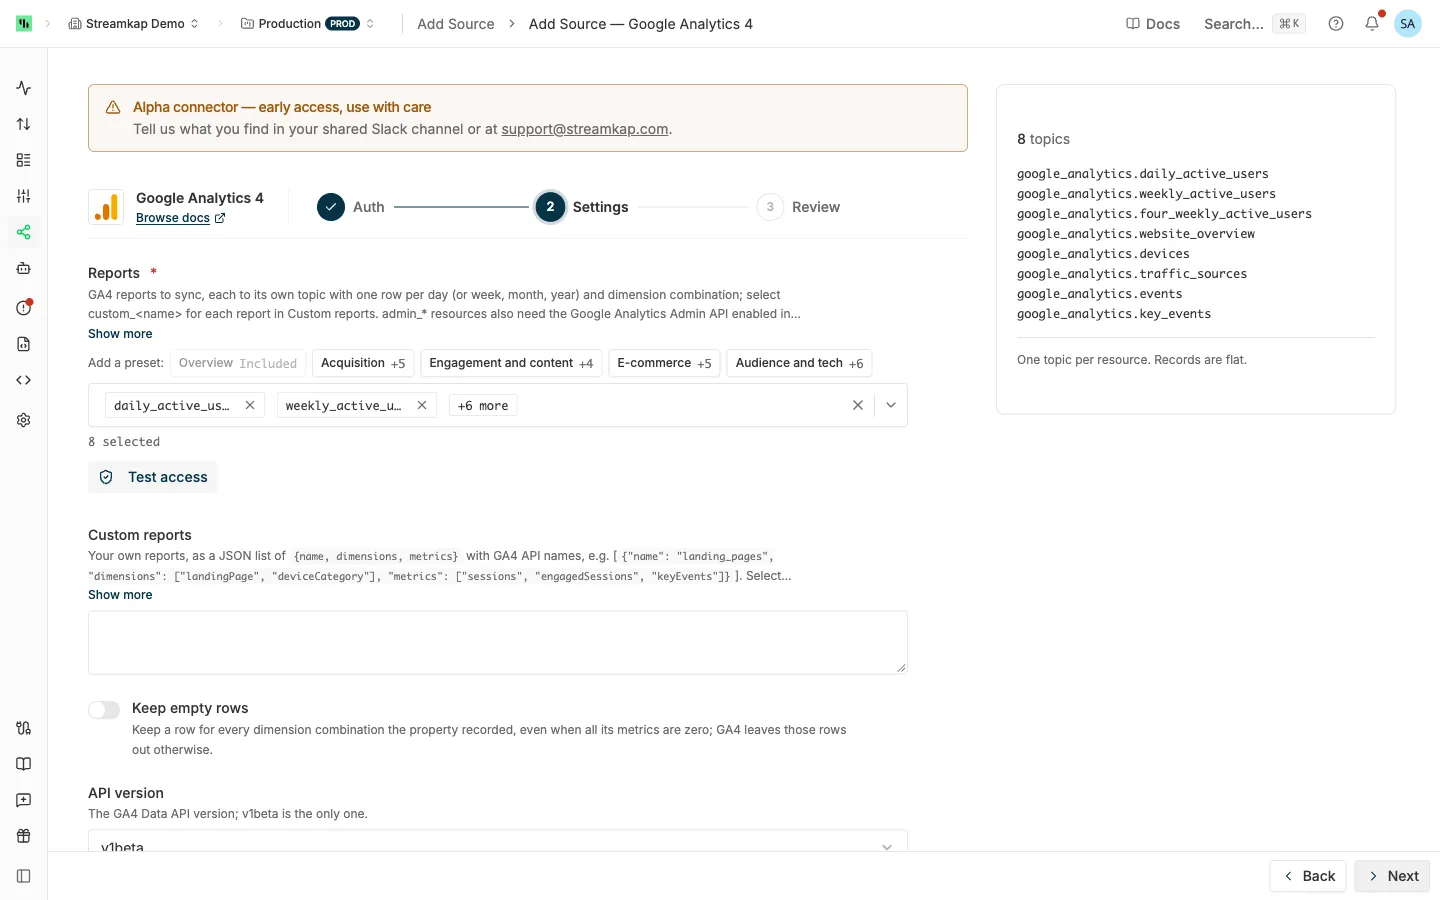
- Reports: The reports and metadata resources to sync; each becomes its own topic. The form starts with the eight defaults in Preset Reports. Select
custom_<name>for each report in Custom reports. Add a preset adds one of these sets:- Overview: the eight defaults.
- Acquisition:
traffic_acquisition_session_source_medium_report,traffic_acquisition_session_default_channel_group_report,traffic_acquisition_session_campaign_report,user_acquisition_first_user_source_medium_report,user_acquisition_first_user_campaign_report. - Engagement and content:
pages,pages_path_report,pages_title_and_screen_name_report,events,key_events,content_group_report. - E-commerce:
transactions,ecommerce_purchases_item_name_report,ecommerce_purchases_item_id_report,ecommerce_purchases_item_category_report,ecommerce_purchases_item_brand_report. - Audience and tech:
demographic_country_report,demographic_city_report,demographic_language_report,tech_browser_report,tech_device_category_report,tech_operating_system_report.
- Custom reports (optional): Your own report definitions as JSON. See Custom Reports.
- Keep empty rows (off by default): GA4 leaves out rows whose metrics are all zero. Turn this on to keep them.
- API version:
v1beta, the only supported GA4 Data API version. - Backfill start date: Last 90 days (the default), or Specific start date. GA4 has no data before 2015-08-14, and a date after yesterday reads from yesterday. See Backfill start date.
Test access runs each selected report once per property with one row. A passing daily report shows its row count for yesterday, such as 412 rows for yesterday; use it to judge row volume. A custom report that returned no rows for yesterday passes with a warning, because an item-scoped dimension with a session-scoped metric never returns rows.
4. Review and Create
Check the summary and click Create. Streamkap tests the key and every selected report again before it creates the source, and refuses the save if a report fails. Then send the topics to a destination: see Send topics to a destination.
Editing the Source
- Rotating the key: create a new JSON key on the service account, click Replace on the Auth tab, paste it, and save. Then delete the old key in Google Cloud.
- Adding a property: add the service account to it as a Viewer, then add its ID to Additional property IDs. Reports that have already synced read the new property from their current position, not from the Backfill start date. To read its history, reset the source.
- Changing a custom report: a synced definition is fixed, because its dimensions make up every row’s
idand columns. Add the changed definition under a new name and remove the old one.
For adding and removing reports, see Editing an API source.
Preset Reports
There are 69 presets. Every daily report has date as its first dimension. Names are GA4 API names. Default marks the eight a new source starts with.
| Report | Dimensions (after date) |
Metrics | Default |
|---|---|---|---|
daily_active_users |
none | active1DayUsers |
Yes |
weekly_active_users |
none | active7DayUsers |
Yes |
four_weekly_active_users |
none | active28DayUsers |
Yes |
website_overview |
none | Overview, engagedSessions, engagementRate |
Yes |
devices |
deviceCategory, operatingSystem, browser |
Overview | Yes |
traffic_sources |
sessionSource, sessionMedium |
Overview | Yes |
events |
eventName |
eventCount, totalUsers, eventCountPerUser, totalRevenue |
Yes |
key_events |
eventName, filtered to key events |
keyEvents, totalUsers, totalRevenue |
Yes |
locations |
country, region, city |
Overview | |
pages |
hostName, pagePath |
screenPageViews, totalUsers, userEngagementDuration, bounceRate |
|
transactions |
none | activeUsers, averageRevenuePerUser, newUsers, purchaseRevenue, sessions, totalRevenue, transactions |
|
traffic_sources_by_platform |
source, medium, sourcePlatform |
activeUsers, sessions, sessionsPerUser, bounceRate, engagementRate |
|
locations_with_ids |
country, countryId, region, city, cityId |
Overview with activeUsers for totalUsers, plus engagementRate |
|
devices_with_model |
deviceCategory, deviceModel, operatingSystem, browser |
As locations_with_ids |
|
pages_by_session_source |
hostName, pagePath, sessionMedium, sessionSource |
activeUsers, bounceRate, engagedSessions, engagementRate, eventCount, screenPageViews, screenPageViewsPerUser, screenPageViewsPerSession, userEngagementDuration |
|
audiences_report |
audienceName |
activeUsers, averageSessionDuration, newUsers, screenPageViewsPerSession, sessions, totalRevenue |
Overview is totalUsers, newUsers, sessions, sessionsPerUser, averageSessionDuration, screenPageViews, screenPageViewsPerSession and bounceRate. pages reads pagePath without the query string, which can carry tokens and multiplies the row count.
The report families share one metric set each, and each report adds the dimension named after it:
| Family | Reports and their dimension | Metrics |
|---|---|---|
| User acquisition | user_acquisition_first_user_medium_report (firstUserMedium), …_source_report (firstUserSource), …_source_platform_report (firstUserSourcePlatform), …_campaign_report (firstUserCampaignName), …_google_ads_ad_network_type_report (firstUserGoogleAdsAdNetworkType), …_google_ads_ad_group_name_report (firstUserGoogleAdsAdGroupName), …_source_medium_report (firstUserSource, firstUserMedium) |
newUsers, engagedSessions, engagementRate, eventCount, keyEvents, totalRevenue, totalUsers, userEngagementDuration |
| Traffic acquisition | traffic_acquisition_session_source_medium_report (sessionSource, sessionMedium), …_medium_report (sessionMedium), …_source_report (sessionSource), …_campaign_report (sessionCampaignName), …_default_channel_group_report (sessionDefaultChannelGroup), …_source_platform_report (sessionSourcePlatform) |
totalUsers, sessions, engagedSessions, eventsPerSession, engagementRate, eventCount, keyEvents, totalRevenue, userEngagementDuration |
| Pages and screens | pages_title_and_screen_class_report (unifiedScreenClass), pages_path_report (pagePath), pages_title_and_screen_name_report (unifiedScreenName), content_group_report (contentGroup) |
screenPageViews, totalUsers, newUsers, eventCount, keyEvents, totalRevenue, userEngagementDuration |
| Ecommerce purchases | ecommerce_purchases_item_name_report (itemName), …_item_id_report (itemId), …_item_category_report (itemCategory), …_item_category_2_report to …_item_category_5_report (itemCategory2 to itemCategory5), …_item_brand_report (itemBrand), …_item_category_report_combined (all five categories) |
cartToViewRate, purchaseToViewRate, itemsPurchased, itemRevenue, itemsAddedToCart, itemsViewed |
| Publisher ads | publisher_ads_ad_unit_report (adUnitName), …_page_path_report (pagePath), …_ad_format_report (adFormat), …_ad_source_report (adSourceName) |
publisherAdImpressions, adUnitExposure, publisherAdClicks, totalAdRevenue |
| Demographics | demographic_country_report, …_region_report, …_city_report, …_language_report (country, region, city, language), …_age_report (userAgeBracket), …_gender_report (userGender), …_interest_report (brandingInterest) |
totalUsers, newUsers, engagedSessions, engagementRate, keyEvents, totalRevenue |
| Tech | tech_browser_report (browser), …_device_category_report (deviceCategory), …_device_model_report (deviceModel), …_screen_resolution_report (screenResolution), …_app_version_report (appVersion), …_platform_report (platform), …_platform_device_category_report (platform, deviceCategory), …_operating_system_report (operatingSystem), …_os_with_version_report (operatingSystemWithVersion), …_os_version_report (operatingSystemVersion) |
totalUsers, newUsers, engagedSessions, engagementRate, eventCount, keyEvents, totalRevenue |
Five presets read a whole week (yearWeek, Sunday to Saturday), month (yearMonth) or year (year) in place of date: weekly_events and monthly_events (the events report), and weekly_website_overview, monthly_website_overview and yearly_website_overview (the website_overview report). User counts are not additive, so each period is read whole: the current period every poll, and the one before while its last days can still change. yearly_website_overview re-reads two whole years every hour and costs the most quota of the daily-cadence reports.
realtime_overview holds the property’s last 30 minutes, with no dimensions and the metrics activeUsers, eventCount, keyEvents and screenPageViews. For a realtime breakdown, define a custom report with "realtime": true.
A preset never changes under its name; a changed definition ships under a new name.
Metadata Resources
These describe the properties rather than their traffic. Each is re-read whole hourly, and a row that is gone is deleted.
| Resource | One row per |
|---|---|
admin_accounts |
Analytics account the service account can see |
admin_properties |
property of the source |
admin_data_streams |
web and app data stream |
admin_custom_dimensions |
custom dimension |
admin_custom_metrics |
custom metric |
admin_key_events |
key event |
admin_google_ads_links |
Google Ads link |
metadata_dimensions |
dimension a property offers, standard and custom |
metadata_metrics |
metric a property offers, with any blocked_reasons from a data restriction |
The admin_* resources read the Google Analytics Admin API. Each row carries every field Google documents for the object, in snake_case; a nested object or list is one JSON text column. id is the object’s resource name, such as properties/123456789/customDimensions/111, or <property>|<apiName> for the metadata_* resources. Measurement Protocol secrets are not synced.
Custom Reports
Custom reports is a JSON list of definitions. Each becomes the report custom_<name>, which you then select in Reports:
[
  {
    "name": "landing_pages",
    "dimensions": ["landingPage", "deviceCategory"],
    "metrics": ["sessions", "engagedSessions", "keyEvents"]
  },
  {
    "name": "tutorial_progress",
    "dimensions": ["customEvent:level"],
    "metrics": ["eventCount"],
    "dimension_filter": {
      "filter": { "fieldName": "eventName", "stringFilter": { "value": "tutorial_begin" } }
    }
  }
]
Rules, checked when you save:
name: lowercase letters, digits and underscores, starting with a letter, at most 41 characters, each defined once.dimensions: at most 9, includingdate, which is added first if you leave it out.metrics: 1 to 10.- Names are GA4 API names, standard (
sessionSource) or custom (customEvent:level,customEvent:level[tutorial_start],sessionCustomChannelGroup:1234), none twice. ThecurrencyCodedimension is refused because it clashes with thecurrency_codecolumn. dimension_filter,metric_filter(optional): GA4FilterExpressionobjects, sent as written.grain(optional):dateHour,yearWeek,isoYearIsoWeek,yearMonthoryearin place ofdate; the report cannot also requestdateor another grain.dateHourgives one row per hour, with the hour in adate_hourcolumn (YYYYMMDDHH, property time zone) that is part of theid, and is re-read by whole days.metric_aggregations(optional): any ofTOTAL,MINIMUM,MAXIMUM. See Aggregate rows. The report then makes one request per day of its window.comparisons(optional): GA4Comparisonobjects, each with exactly anameand adimensionFilter; rows carry the name in acomparisoncolumn that is part of theid. A saved comparison ("comparison": "comparisons/1234") is refused, because it can change in Google Analytics without the definition changing. Copy its filter instead.- Every selected
custom_<name>needs a definition, and every definition must be selected. - The property must define every name, and GA4 must accept the combination; GA4 Query Explorer is a quick way to try one first.
Re-listed Custom Reports
A definition with one of these keys has no date to resume from. It is read whole every poll, gets no date dimension, and a row that is gone is deleted (see Re-listed reports):
date_ranges: 1 to 4 GA4DateRangeobjects, such as{"startDate": "28daysAgo", "endDate": "yesterday", "name": "last_28"}. With several, each row carries its range’s name in adate_rangecolumn.pivots: GA4Pivotobjects, read withrunPivotReport. Needsdate_rangesor acohort_spec; every dimension in exactly one pivot’sfieldNames; alimiton each pivot, with the limits’ product at most 10,000; nooffset. A pivot’smetricAggregationsgo inside the pivot.cohort_spec: a GA4CohortSpec. The report must request thecohortdimension and takes nodate_ranges.realtime:truereads the last 30 minutes withrunRealtimeReportevery poll interval. Realtime dimensions and metrics only, optionalminute_ranges(up to 2), and no cohort, date ranges, pivots or comparisons.
[
  { "name": "weekly_landing", "grain": "yearWeek", "dimensions": ["landingPage"], "metrics": ["sessions"] },
  {
    "name": "browser_by_country",
    "dimensions": ["country", "browser"],
    "metrics": ["sessions"],
    "date_ranges": [{ "startDate": "28daysAgo", "endDate": "yesterday" }],
    "pivots": [
      { "fieldNames": ["country"], "limit": 50, "metricAggregations": ["TOTAL"] },
      { "fieldNames": ["browser"], "limit": 5 }
    ]
  },
  {
    "name": "retention",
    "dimensions": ["cohort", "cohortNthWeek"],
    "metrics": ["cohortActiveUsers"],
    "cohort_spec": {
      "cohorts": [{ "name": "august", "dimension": "firstSessionDate", "dateRange": { "startDate": "2026-08-01", "endDate": "2026-08-07" } }],
      "cohortsRange": { "granularity": "WEEKLY", "endOffset": 5 }
    }
  }
]
What Each Record Contains
One record is one GA4 row: a day, a combination of dimension values, and its metrics. A devices record (values illustrative):
{
  "id": "123456789|devices|2026-09-24|desktop|Windows|Chrome",
  "property_id": "123456789",
  "date": "2026-09-24",
  "currency_code": "USD",
  "device_category": "desktop",
  "operating_system": "Windows",
  "browser": "Chrome",
  "total_users": 1520,
  "new_users": 310,
  "sessions": 2104,
  "sessions_per_user": 1.384,
  "average_session_duration": 142.7,
  "screen_page_views": 6120,
  "screen_page_views_per_session": 2.91,
  "bounce_rate": 0.42
}idis the property ID, report name, date and dimension values in order, joined with|(|and%inside a value are escaped as%7Cand%25). It is the Kafka key and stays the same each time GA4 serves the row. A weekly, monthly or yearly row adds the period’s value after the date (…|weekly_events|2026-09-20|202639|page_view); a re-listed report’s row has no date (…|custom_live_cities|France|Paris).dateis the report day asYYYY-MM-DD, or the first day of the period. A re-listed report carriesstreamkap_changed_at, the poll that last saw the row change, instead.currency_codeis the property’s currency; realtime reports have none.- Dimensions and metrics are one column each, in snake_case:
sessionDefaultChannelGroupbecomessession_default_channel_group,active1DayUsersbecomesactive1_day_users. A custom definition keeps its case-sensitive parameter name after the scope and__:customEvent:levels_unlockedbecomescustom_event__levels_unlocked. - An empty value and GA4’s
(not set)are different values with differentids. - Types: dimensions,
id,property_id,dateandcurrency_codeare strings. 17 pure-count metrics are 64-bit integers:active1DayUsers,active7DayUsers,active28DayUsers,activeUsers,totalUsers,newUsers,sessions,engagedSessions,screenPageViews,eventCount,itemsViewed,itemsAddedToCart,itemsPurchased,transactions,ecommercePurchases,publisherAdImpressions,publisherAdClicks. Every other metric, includingkeyEventsand every custom metric, is a double. If GA4 starts serving an integer metric as a decimal, the report’s poll fails naming the metric.
Aggregate Rows
With metric_aggregations, each day’s (or period’s) totals, minimums and maximums arrive in the same topic. Every dimension holds GA4’s RESERVED_TOTAL, RESERVED_MINIMUM or RESERVED_MAXIMUM, a row_type column says row, total, minimum or maximum, and the id ends with one extra RESERVED_… part so it never equals a data row’s. Filter on row_type = 'row' to leave them out.
Behavior & Limits
Backfill
Each report’s first poll reads from the Backfill start date through today, in the property’s time zone. A long backfill arrives over several polls that run back to back.
Restatement
GA4 revises recent days: data can change for 24 to 48 hours, late events are accepted for two days plus today, and key-event attribution can change for up to 12 days. Every poll re-reads a window before the latest day it has seen:
- 3 days for most reports.
- 13 days for
key_events,traffic_sources_by_platform, and any custom report with a key-event-attributed dimension:source,medium,sourceMedium,sourcePlatform,campaignId,campaignName,defaultChannelGroup,primaryChannelGroup, and names starting withmanual,googleAds,cm360,dv360orsa360.
An unchanged row is not sent again. A changed row is sent again with the same id, so set the destination to upsert on id and never sum the topic: an append-only destination keeps every version.
A row GA4 stops returning for a re-read day (all its metrics restated to zero, with Keep empty rows off) is deleted. Streamkap remembers up to 5,000 row ids per report for this, about 1,250 rows a day at a 3-day window; a vanished row beyond that memory stays in the destination. A re-read cut short, for example by a quota hold, deletes nothing.
Re-listed Reports
Realtime, pivot, cohort and fixed-date-range reports, and the metadata resources, are read whole every poll. A new or changed row is sent, an unchanged one is not, and a row no longer served (a city with no active users in the last 30 minutes, an archived custom dimension) is deleted. Deletes are tracked for up to 10,000 rows per property; past that, most vanished rows are not deleted. A realtime read is one request of at most 250,000 rows; a property serving more is read cut, and nothing of that property is deleted on that poll.
Row Volume and Duplicates
A report whose re-read window holds more than 5,000 rows sends some unchanged rows again every poll, as duplicate upserts: above about 1,250 rows a day for a 3-day report, or 357 for a 13-day one. They are harmless to an upserting destination but cost throughput, up to about 10,000 duplicates an hour per report. That is why locations, pages and ecommerce_purchases_item_name_report are off by default. Multiply the Test access row count by 4 (or 14) to see where a report stands.
Cadence
Reports and metadata resources poll hourly. Realtime reports poll every poll interval, 5 minutes by default.
Quota
GA4 meters the Data API in tokens per property: a Standard property has 200,000 a day, 40,000 an hour and 14,000 per Cloud project an hour; Analytics 360 has ten times as many. There are also limits of 10 concurrent requests, 10 server errors per project an hour and 120 potentially thresholded requests an hour. The quota is shared with everything else that reads the property, such as Looker Studio: once a bucket is empty, every request to the property fails.
Streamkap reads the remaining quota from every response. When a bucket falls to about 5% of its Standard size, the report keeps the rows it has read and holds:
- for an hourly bucket, one hour;
- for the daily bucket, until one hour after the next midnight Pacific time (
America/Los_Angeles), when GA4 resets it.
The source shows Throttled with the time it resumes, and resumes on its own. If GA4 refuses a request because the daily quota is spent, the source is held until the same reset. An hourly-quota refusal fails that poll, and the next hourly poll retries. With several properties, a low bucket on any of them holds the whole report.
The connector paces its requests and retries a server error only a few times, because GA4 blocks a Cloud project from a property after 10 server errors in an hour.
Access Problems
- A rejected key, or a Data API that is not enabled, stops all syncing. The source stays Broken until you fix the cause and save it.
- Lost access to one of several properties: that property is skipped with a warning in every report, and its rows already in the destination stay. It rejoins once access is restored; reset the source to read the days it missed.
- Lost access to the only property, or to all of them: every report pauses and is retried on its own, or at once when you save the source.
- Admin API not enabled: only the
admin_*resources pause.
GA4 can withhold rows for privacy (thresholding), sample large results, and group excess values into an (other) row. Rows arrive as GA4 served them; the record does not say whether a row was thresholded or sampled.
Funnel reports are not supported. Connecting with Sign in with Google is not supported: paste a service-account key.
Troubleshooting
"The service account key is not valid JSON"
The pasted value is not the whole key file. Open the downloaded .json file in a text editor and paste all of it, from { to }, or create a new JSON key.
"This is not a service account key; OAuth client files and API keys do not work here"
The JSON is another kind of Google credential. Create a key on a service account under IAM & Admin → Service accounts → Keys → Add key → Create new key → JSON, and paste that file.
"… missing its client_email or private_key", or "… private_key is not a valid RSA private key"
The key file is incomplete or was edited, including its line breaks. Paste it exactly as downloaded, or create a new JSON key.
"Google rejected the service account key"
The key was deleted or disabled in Google Cloud, or its service account no longer exists. Create a new JSON key on an existing service account and paste it on the Auth tab with Replace. For a new service account, add it to the property as a Viewer first.
"The Google Analytics Data API is not enabled in the Google Cloud project …"
In the key’s project open APIs & Services → Library, enable Google Analytics Data API, wait a few minutes, and test or save again.
"… does not have sufficient permissions on GA4 property …"
The service account is not a user of the property, or Property ID names a different property. Add the client_email as a Viewer under Admin → Property access management, and check the ID. See Access Problems.
"Property ID must be the numeric ID …"
A Measurement ID (G-…) identifies a web data stream, not a property. Copy the number from Admin → Property details.
Couldn't list your properties: the Google Analytics Admin API is not enabled
The Property ID picker reads the Admin API. Enable Google Analytics Admin API in the key’s project, or type the property IDs.
A report "would sync as zeros"
The service account has the No Revenue Metrics or No Cost Metrics restriction on the property, and the report asks for a restricted metric. Remove the restriction under Admin → Property access management, or deselect the report.
"GA4 property … does not define …"
The report asks for a dimension or metric the property does not have, usually a custom definition from another property or a misspelled name. Check the name on the GA4 Data API schema page or under Admin → Custom definitions. A preset that fails this way can only be deselected.
"GA4 refused …" a report
GA4 will not report those dimensions and metrics together, or rejected a filter. Change the custom report’s dimensions and metrics, try the combination in GA4 Query Explorer, and add it under a new name if the old one has synced.
"Custom report custom_… changed …"
A synced custom report’s definition was edited. Restore the original, or add the new definition under a new name. See Editing the Source.
"The Google Analytics Admin API is not enabled", or an admin_* resource paused
Enable Google Analytics Admin API in the key’s project and save the source, or deselect the admin_* resources.
The same day appears with different values, or totals look too high
GA4 revised the day and the revision arrived with the same id. Set the destination to upsert on id, and do not sum rows from the topic. See Restatement.
Numbers differ from the GA4 interface
The interface and the Data API can apply thresholding, sampling or (other) rows differently, and recent days are still being revised. Compare a day older than the re-read window, with the same dimensions: user counts are not additive.
Related Documentation
- API sources - how API sources work, Test access, sending topics to a destination, and statuses
- Google Ads - Google Ads objects and daily performance reports
- Facebook Ads - Meta ad objects and daily insights reports