> ## Documentation Index
> Fetch the complete documentation index at: https://docs.streamkap.com/llms.txt
> Use this file to discover all available pages before exploring further.
# Observability
> Monitor system health, data lineage, and record count accuracy across your Streamkap pipelines
## Observability
Navigate to **Observability** in the project sidebar to see the observability dashboard.
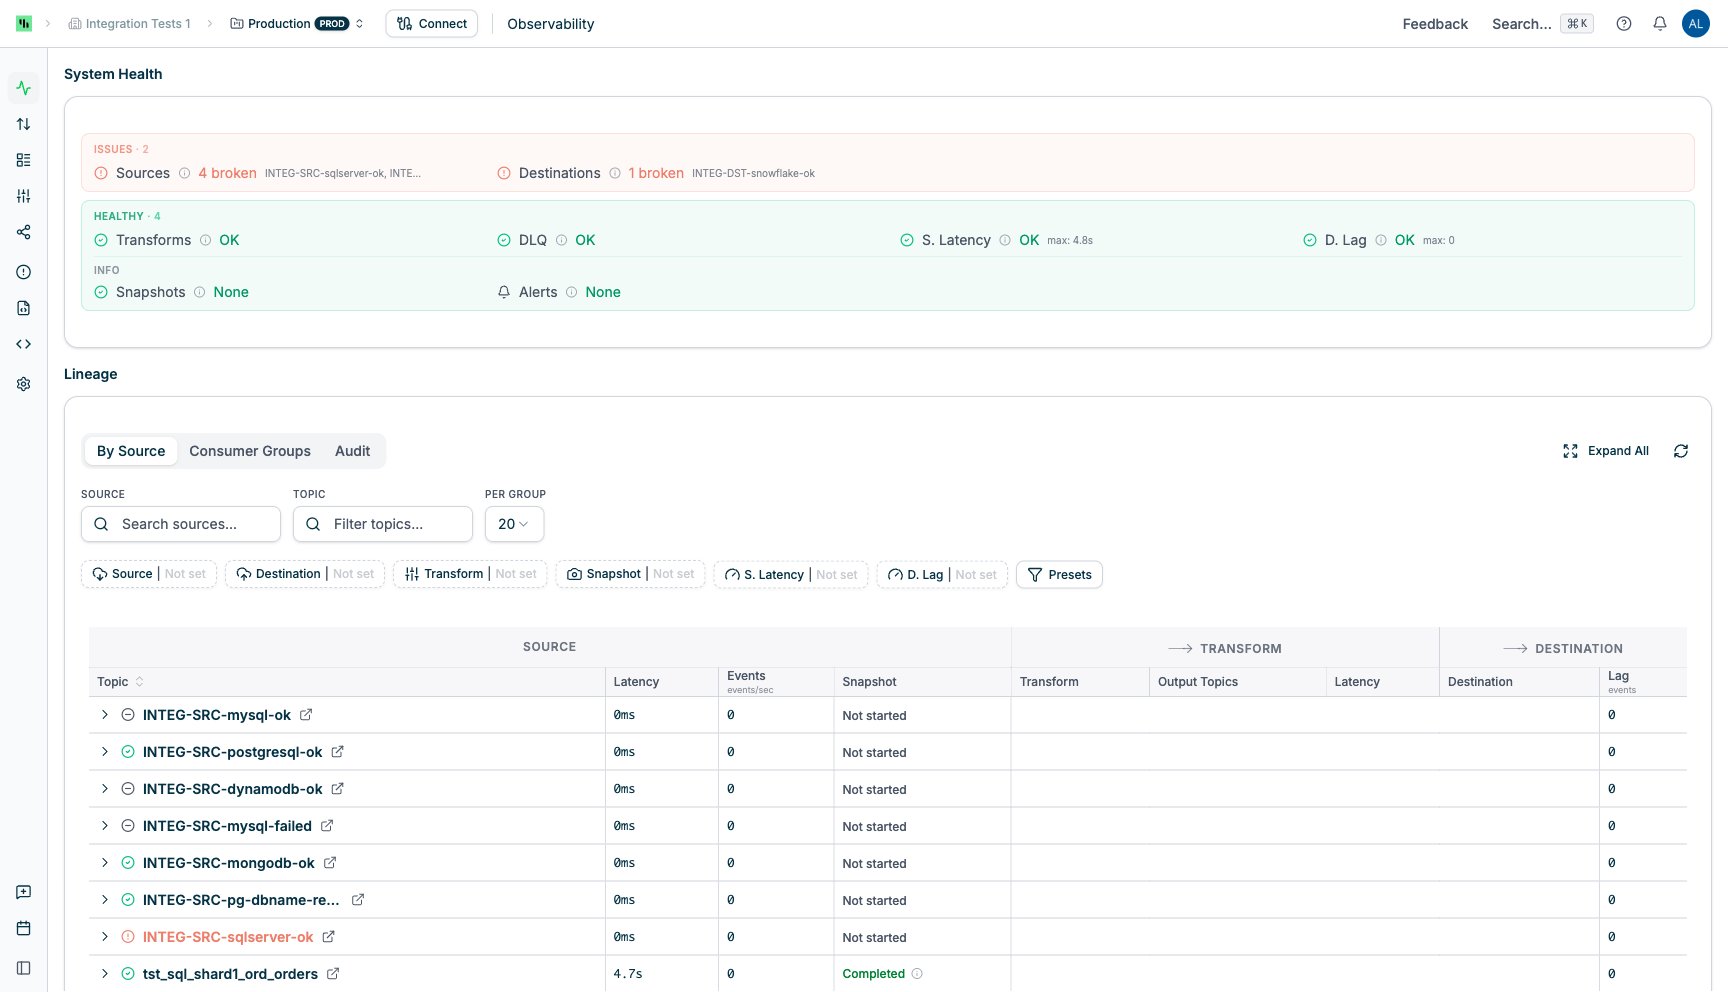 The observability view includes:
1. **[System Health](#system-health)** — operational status summary at the top
2. **[Lineage](#lineage)** — data flow details with three tabs: [By Source](#by-source), [Consumer Groups](#consumer-groups), and [Audit](#audit)
## System Health
Summarizes operational status. Items are grouped into colored sections based on their current state.
### Issues
Red section — appears only when there are active problems.
| Indicator | Description |
| ---------------- | ----------------------------------------------------------------------------------------- |
| **Sources** | Source connectors in an error state. Shows count and names of affected sources. |
| **Destinations** | Destination connectors in an error state. Shows count and names of affected destinations. |
| **Transforms** | Transform jobs that have failed. Shows count of affected transforms. |
### Warnings
Amber section — appears only when there are active warnings.
| Indicator | Description |
| -------------- | ----------------------------------------------------------------------- |
| **DLQ** | Dead Letter Queue topics containing undeliverable records. |
| **S. Latency** | Topics where source latency exceeds 10 minutes. Shows max latency. |
| **D. Lag** | Topics where the destination consumer has fallen behind. Shows max lag. |
### Healthy
Green section — shows all indicators that are currently OK. When everything is healthy, all issue and warning indicators appear here.
### Info
Shows general operational metrics below the Healthy section:
| Indicator | Description |
| ------------- | ----------------------------------------------------------------- |
| **Snapshots** | Topics currently performing an initial data load from the source. |
| **Alerts** | Unread alert notifications for this project. |
Health items with active issues are clickable — they scroll to the lineage table and apply the relevant filters automatically (e.g., clicking **Sources** filters the lineage by broken source connectors, clicking **DLQ** applies the DLQ quick filter).
## Lineage
Shows how data flows through your pipelines — from sources, through optional transforms, to destinations.
### By Source
Groups topics by their source connector (default tab).
The observability view includes:
1. **[System Health](#system-health)** — operational status summary at the top
2. **[Lineage](#lineage)** — data flow details with three tabs: [By Source](#by-source), [Consumer Groups](#consumer-groups), and [Audit](#audit)
## System Health
Summarizes operational status. Items are grouped into colored sections based on their current state.
### Issues
Red section — appears only when there are active problems.
| Indicator | Description |
| ---------------- | ----------------------------------------------------------------------------------------- |
| **Sources** | Source connectors in an error state. Shows count and names of affected sources. |
| **Destinations** | Destination connectors in an error state. Shows count and names of affected destinations. |
| **Transforms** | Transform jobs that have failed. Shows count of affected transforms. |
### Warnings
Amber section — appears only when there are active warnings.
| Indicator | Description |
| -------------- | ----------------------------------------------------------------------- |
| **DLQ** | Dead Letter Queue topics containing undeliverable records. |
| **S. Latency** | Topics where source latency exceeds 10 minutes. Shows max latency. |
| **D. Lag** | Topics where the destination consumer has fallen behind. Shows max lag. |
### Healthy
Green section — shows all indicators that are currently OK. When everything is healthy, all issue and warning indicators appear here.
### Info
Shows general operational metrics below the Healthy section:
| Indicator | Description |
| ------------- | ----------------------------------------------------------------- |
| **Snapshots** | Topics currently performing an initial data load from the source. |
| **Alerts** | Unread alert notifications for this project. |
Health items with active issues are clickable — they scroll to the lineage table and apply the relevant filters automatically (e.g., clicking **Sources** filters the lineage by broken source connectors, clicking **DLQ** applies the DLQ quick filter).
## Lineage
Shows how data flows through your pipelines — from sources, through optional transforms, to destinations.
### By Source
Groups topics by their source connector (default tab).
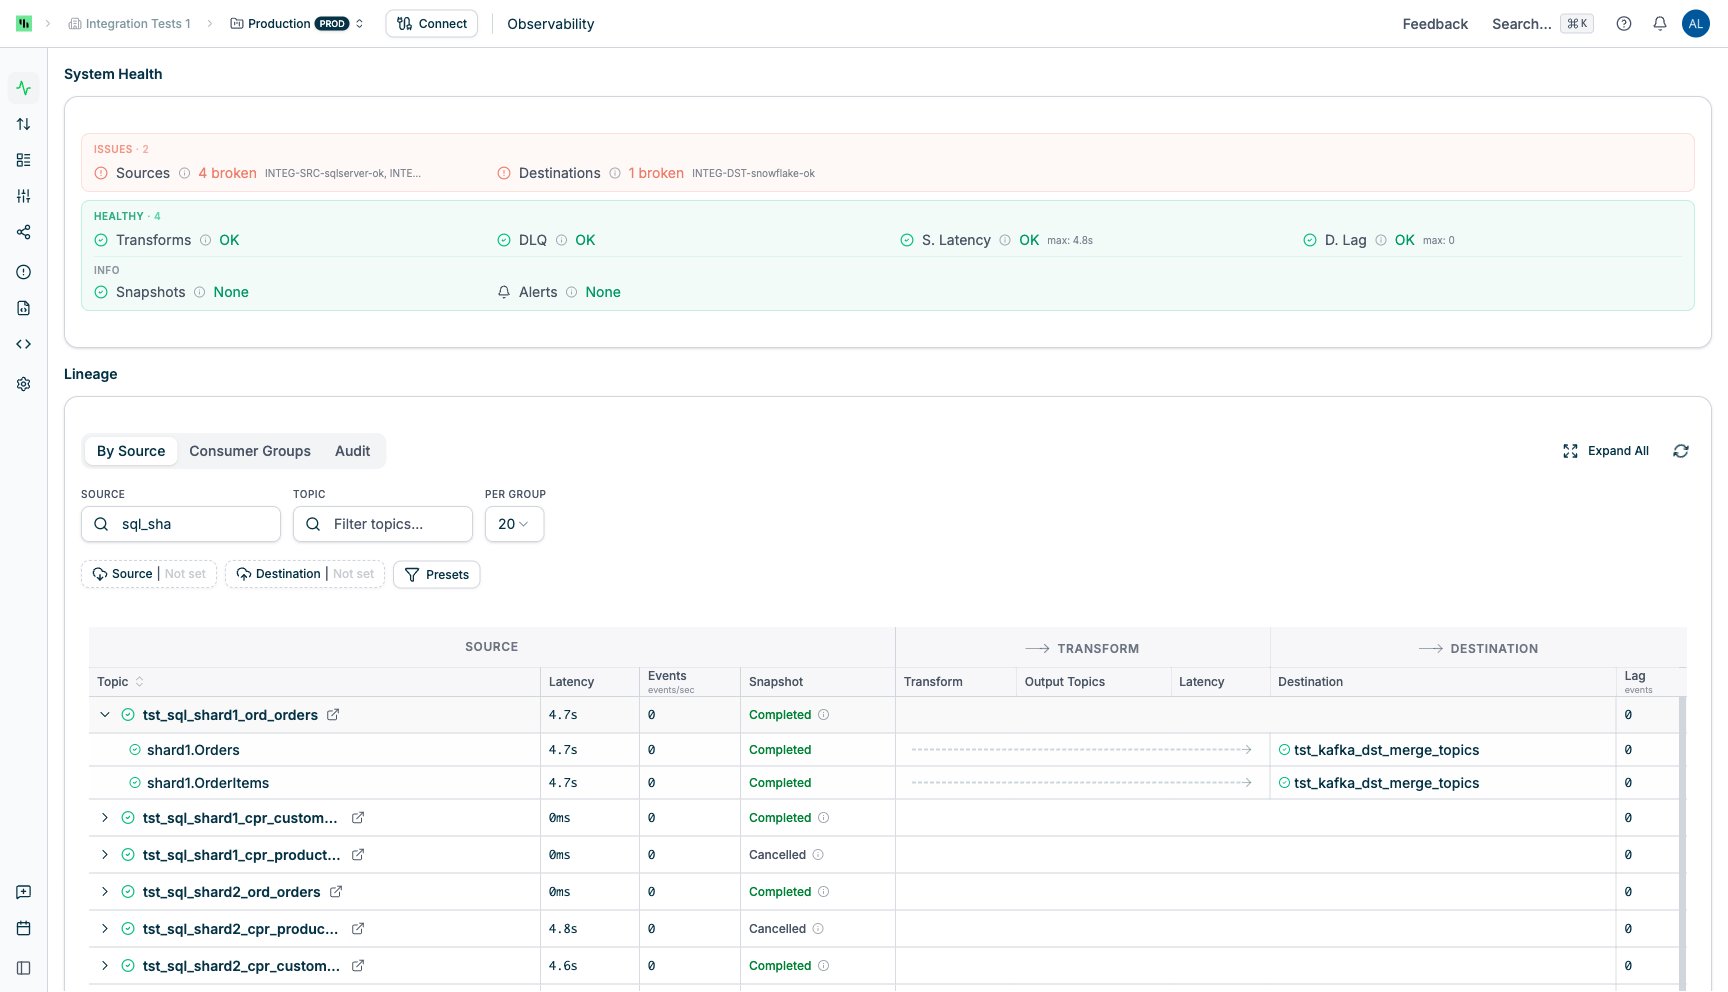 Each source row shows the source name, connector type icon, status, and aggregate metrics. Click a row or use **Expand All** to see individual topics:
| Source columns | Transform columns | Destination columns |
| ------------------------------------------------------------------- | -------------------------------------- | -------------------------------------- |
| Topic name, Status, Latency, Events (events/sec), Snapshot progress | Transform name, Output Topics, Latency | Destination name, Status, Lag (events) |
Source, transform, and destination names include external link icons that navigate to their detail pages. Topic names are clickable and navigate to the topic detail view.
### Audit
Compares record counts between sources and destinations to verify data completeness.
Each source row shows the source name, connector type icon, status, and aggregate metrics. Click a row or use **Expand All** to see individual topics:
| Source columns | Transform columns | Destination columns |
| ------------------------------------------------------------------- | -------------------------------------- | -------------------------------------- |
| Topic name, Status, Latency, Events (events/sec), Snapshot progress | Transform name, Output Topics, Latency | Destination name, Status, Lag (events) |
Source, transform, and destination names include external link icons that navigate to their detail pages. Topic names are clickable and navigate to the topic detail view.
### Audit
Compares record counts between sources and destinations to verify data completeness.
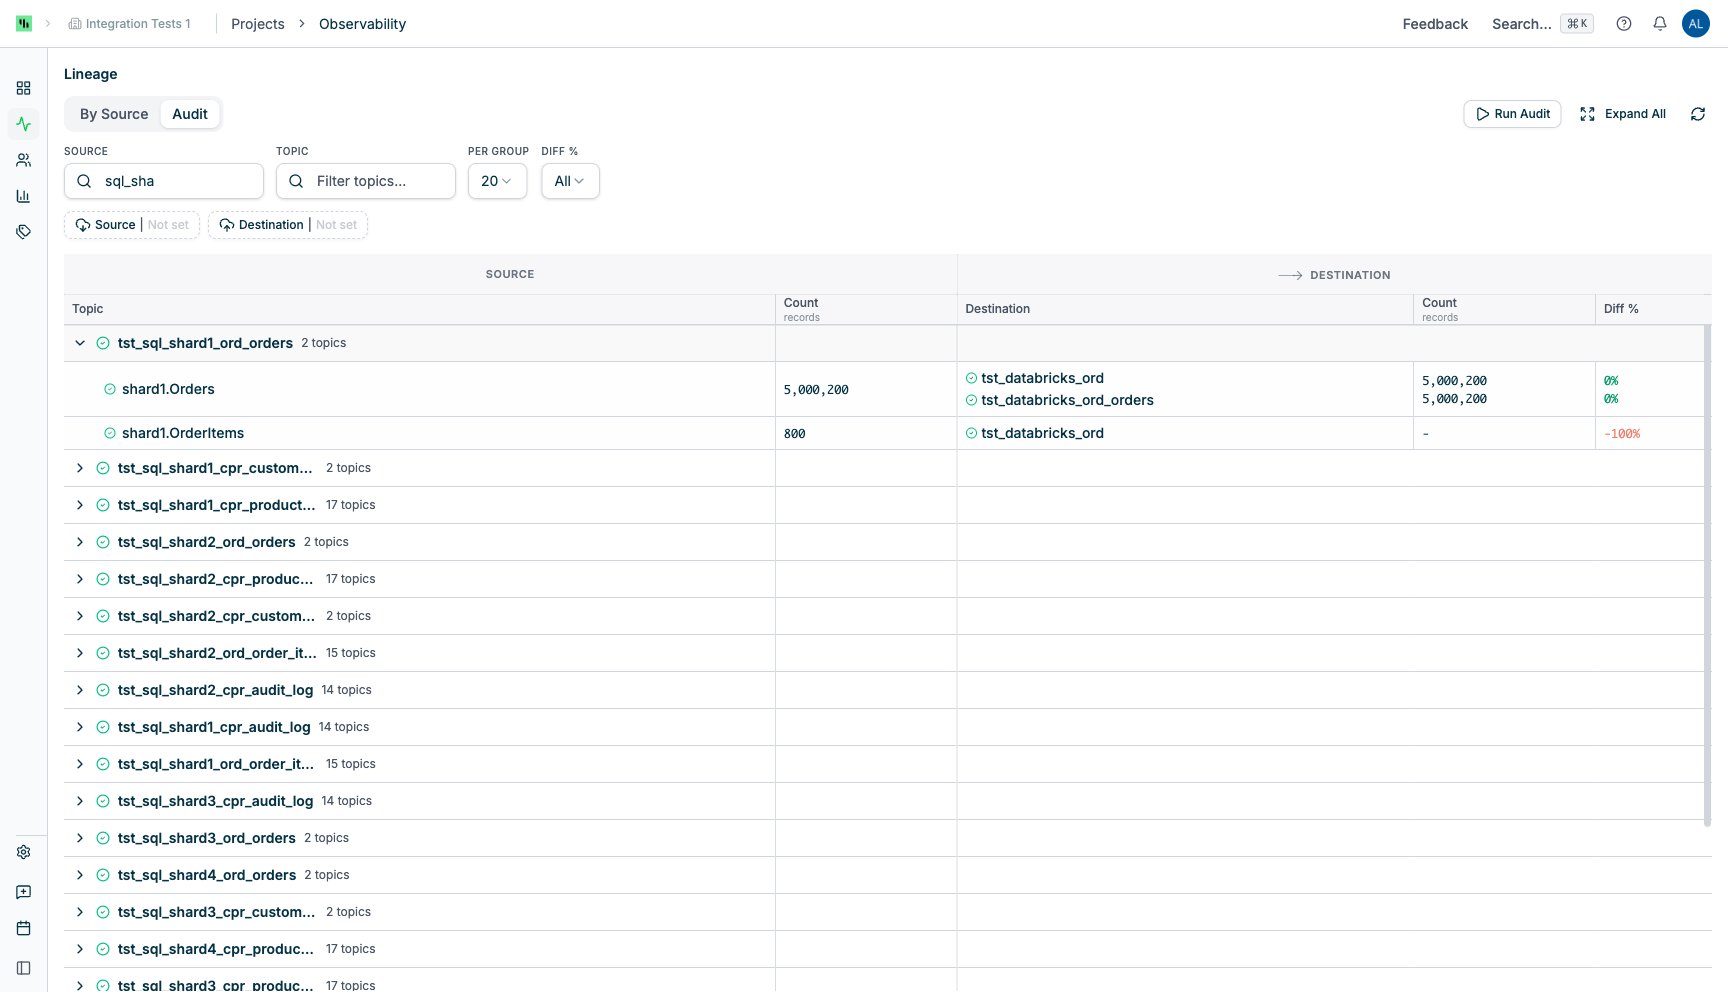 Each source row shows the source name, connector type icon, and topic count. Expand to see per-topic details:
| Source columns | Destination columns |
| --------------------------- | ----------------------------------------- |
| Topic name, Count (records) | Destination name, Count (records), Diff % |
The **Diff %** column shows the percentage difference between source and destination record counts, color-coded by severity:
* **Green** (0–1%) — counts match or near-match
* **Amber** (2–10%) — minor drift
* **Red** (>10%) — significant drift
**Audit-specific controls:**
* **Run Audit** — triggers record count collection for all sources on the current page
* **Diff %** dropdown — filters topics by drift percentage range (All, 0–2%, 2–10%, 10–50%, 50–100%, >100%)
Record counts require a completed audit run. Use the **Run Audit** button to collect counts, then expand source groups to see the results.
### Consumer Groups
Displays Kafka consumer groups and their health status.
Each source row shows the source name, connector type icon, and topic count. Expand to see per-topic details:
| Source columns | Destination columns |
| --------------------------- | ----------------------------------------- |
| Topic name, Count (records) | Destination name, Count (records), Diff % |
The **Diff %** column shows the percentage difference between source and destination record counts, color-coded by severity:
* **Green** (0–1%) — counts match or near-match
* **Amber** (2–10%) — minor drift
* **Red** (>10%) — significant drift
**Audit-specific controls:**
* **Run Audit** — triggers record count collection for all sources on the current page
* **Diff %** dropdown — filters topics by drift percentage range (All, 0–2%, 2–10%, 10–50%, 50–100%, >100%)
Record counts require a completed audit run. Use the **Run Audit** button to collect counts, then expand source groups to see the results.
### Consumer Groups
Displays Kafka consumer groups and their health status.
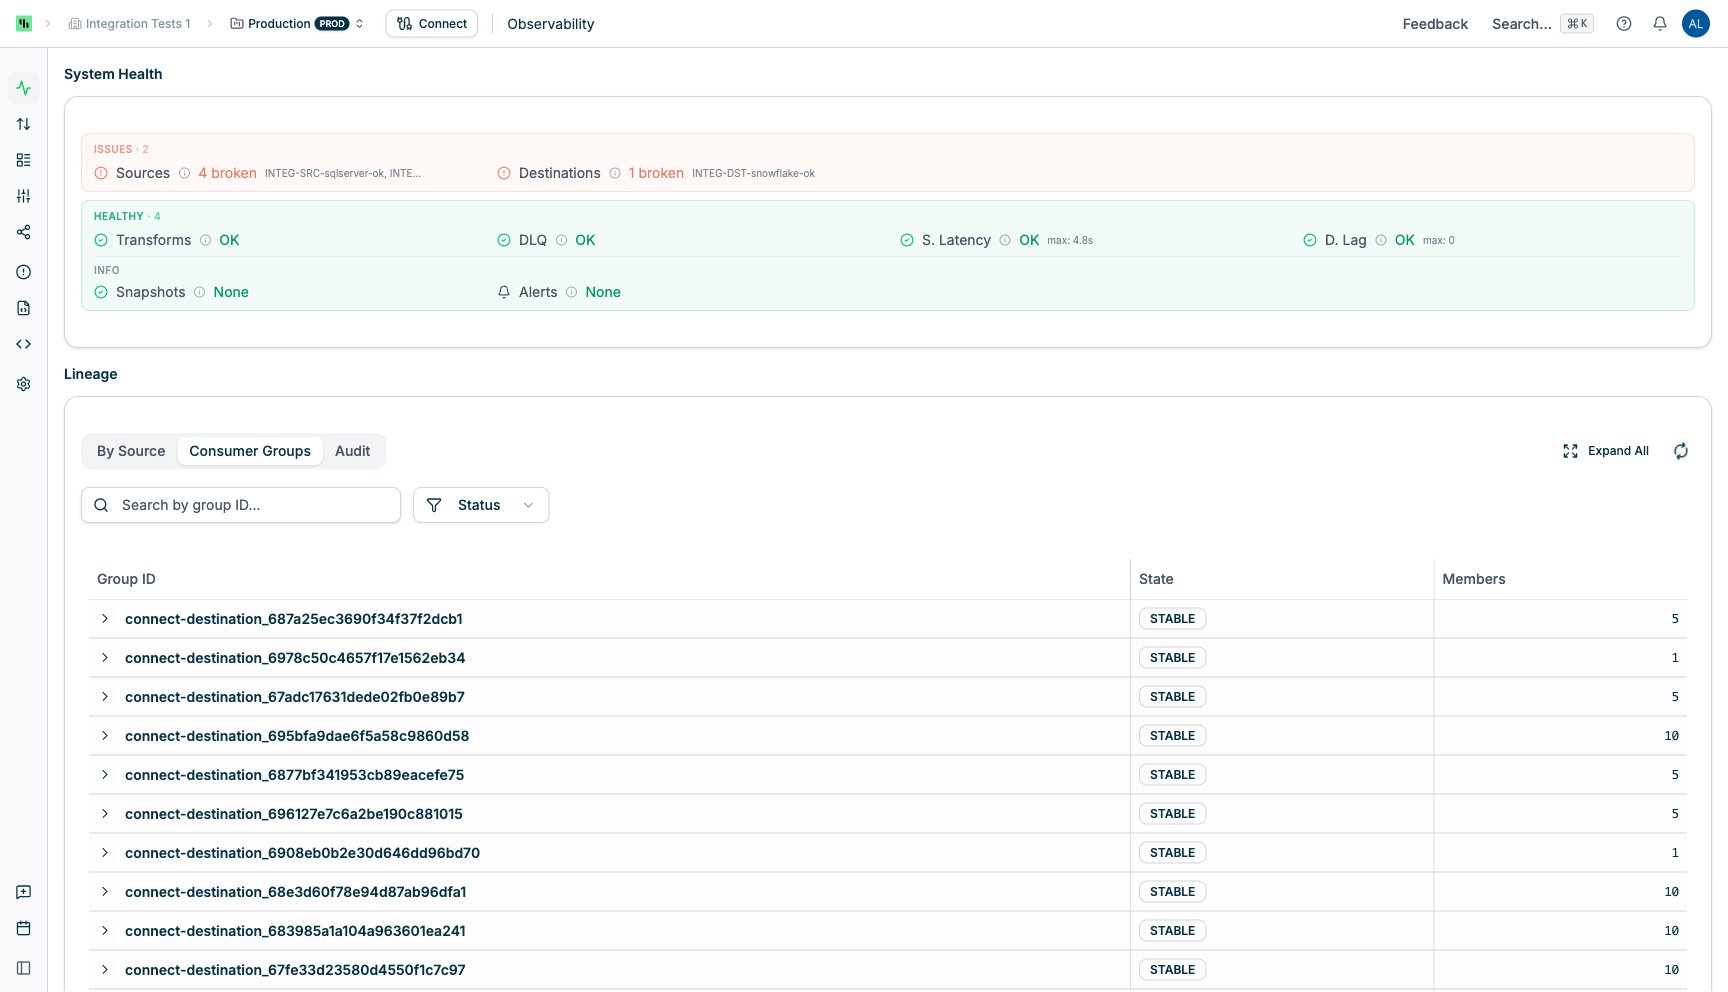 Each row shows the **Group ID** (linked to the consumer group detail page), **State** (Stable, Empty, Dead, PreparingRebalance, CompletingRebalance, Unknown), and **Members** count. Expand a row to see individual members with their Member ID, Client ID, and Host.
**Consumer Groups filters:**
* **Search** — filter by group ID
* **Status** — filter by group state
For full consumer group management including offset resets and lag monitoring, see the [Consumer Groups](/consumer-groups) page.
## Filters
All lineage tabs provide search, filtering, and pagination controls.
### Search
* **Source search** — server-side search on source/group names
* **Topic search** — filters topics within expanded groups. When active, groups auto-expand to show matching topics.
* **Per group** — controls how many topics display per expanded group (5, 10, 20, or 50)
### Entity Filters
Filter badges appear below the search bar. Available filters vary by tab:
| Filter | By Source | Audit | Consumer Groups |
| --------------- | --------- | ----- | --------------- |
| **Source** | Yes | Yes | — |
| **Destination** | Yes | Yes | — |
| **Transform** | Yes | — | — |
| **Snapshot** | Yes | — | — |
| **S. Latency** | Yes | — | — |
| **D. Lag** | Yes | — | — |
| **Status** | — | — | Yes |
The S. Latency and D. Lag filters support comparison operators (`>`, `>=`, `<`, `<=`, `=`, `!=`) with numeric values.
### Presets
The **Presets** dropdown (By Source tab) provides quick filter toggles:
* **Has Destination** — topics with at least one destination pipeline
* **Has Transform** — topics with at least one transform
* **DLQ** — Dead Letter Queue topics
* **Orphaned** — topics without destination pipelines
### Pagination and Controls
* **Expand All / Collapse All** — toggles all groups at once
* **Refresh** — manually re-fetches data (auto-refreshes every 10 seconds)
* **Page size** — configurable items per page
* **Page navigation** — navigate between pages of results
## Related Documentation
* [Alerts](/alerts) — proactive notifications for pipeline issues
* [Consumer Groups](/consumer-groups) — consumer group management and offset resets
* [Topics](/topics) — Kafka topic metrics and message inspection
* [Transforms](/transforms-1) — transform configuration and monitoring
* [Logs](/logs) — troubleshoot pipeline and connector issues
* [DLQ Operations](/dlq-operations) — manage dead letter queue topics
Each row shows the **Group ID** (linked to the consumer group detail page), **State** (Stable, Empty, Dead, PreparingRebalance, CompletingRebalance, Unknown), and **Members** count. Expand a row to see individual members with their Member ID, Client ID, and Host.
**Consumer Groups filters:**
* **Search** — filter by group ID
* **Status** — filter by group state
For full consumer group management including offset resets and lag monitoring, see the [Consumer Groups](/consumer-groups) page.
## Filters
All lineage tabs provide search, filtering, and pagination controls.
### Search
* **Source search** — server-side search on source/group names
* **Topic search** — filters topics within expanded groups. When active, groups auto-expand to show matching topics.
* **Per group** — controls how many topics display per expanded group (5, 10, 20, or 50)
### Entity Filters
Filter badges appear below the search bar. Available filters vary by tab:
| Filter | By Source | Audit | Consumer Groups |
| --------------- | --------- | ----- | --------------- |
| **Source** | Yes | Yes | — |
| **Destination** | Yes | Yes | — |
| **Transform** | Yes | — | — |
| **Snapshot** | Yes | — | — |
| **S. Latency** | Yes | — | — |
| **D. Lag** | Yes | — | — |
| **Status** | — | — | Yes |
The S. Latency and D. Lag filters support comparison operators (`>`, `>=`, `<`, `<=`, `=`, `!=`) with numeric values.
### Presets
The **Presets** dropdown (By Source tab) provides quick filter toggles:
* **Has Destination** — topics with at least one destination pipeline
* **Has Transform** — topics with at least one transform
* **DLQ** — Dead Letter Queue topics
* **Orphaned** — topics without destination pipelines
### Pagination and Controls
* **Expand All / Collapse All** — toggles all groups at once
* **Refresh** — manually re-fetches data (auto-refreshes every 10 seconds)
* **Page size** — configurable items per page
* **Page navigation** — navigate between pages of results
## Related Documentation
* [Alerts](/alerts) — proactive notifications for pipeline issues
* [Consumer Groups](/consumer-groups) — consumer group management and offset resets
* [Topics](/topics) — Kafka topic metrics and message inspection
* [Transforms](/transforms-1) — transform configuration and monitoring
* [Logs](/logs) — troubleshoot pipeline and connector issues
* [DLQ Operations](/dlq-operations) — manage dead letter queue topics