> ## Documentation Index
> Fetch the complete documentation index at: https://docs.streamkap.com/llms.txt
> Use this file to discover all available pages before exploring further.
# Alerts
> Monitor and receive real-time notifications for pipeline and connector events
Alerts provide real-time notifications for critical events in your Streamkap environment, including pipeline state changes, connector actions, latency issues, and system events. Configure delivery channels and customize which alerts you receive to stay informed about your data infrastructure.
## Overview
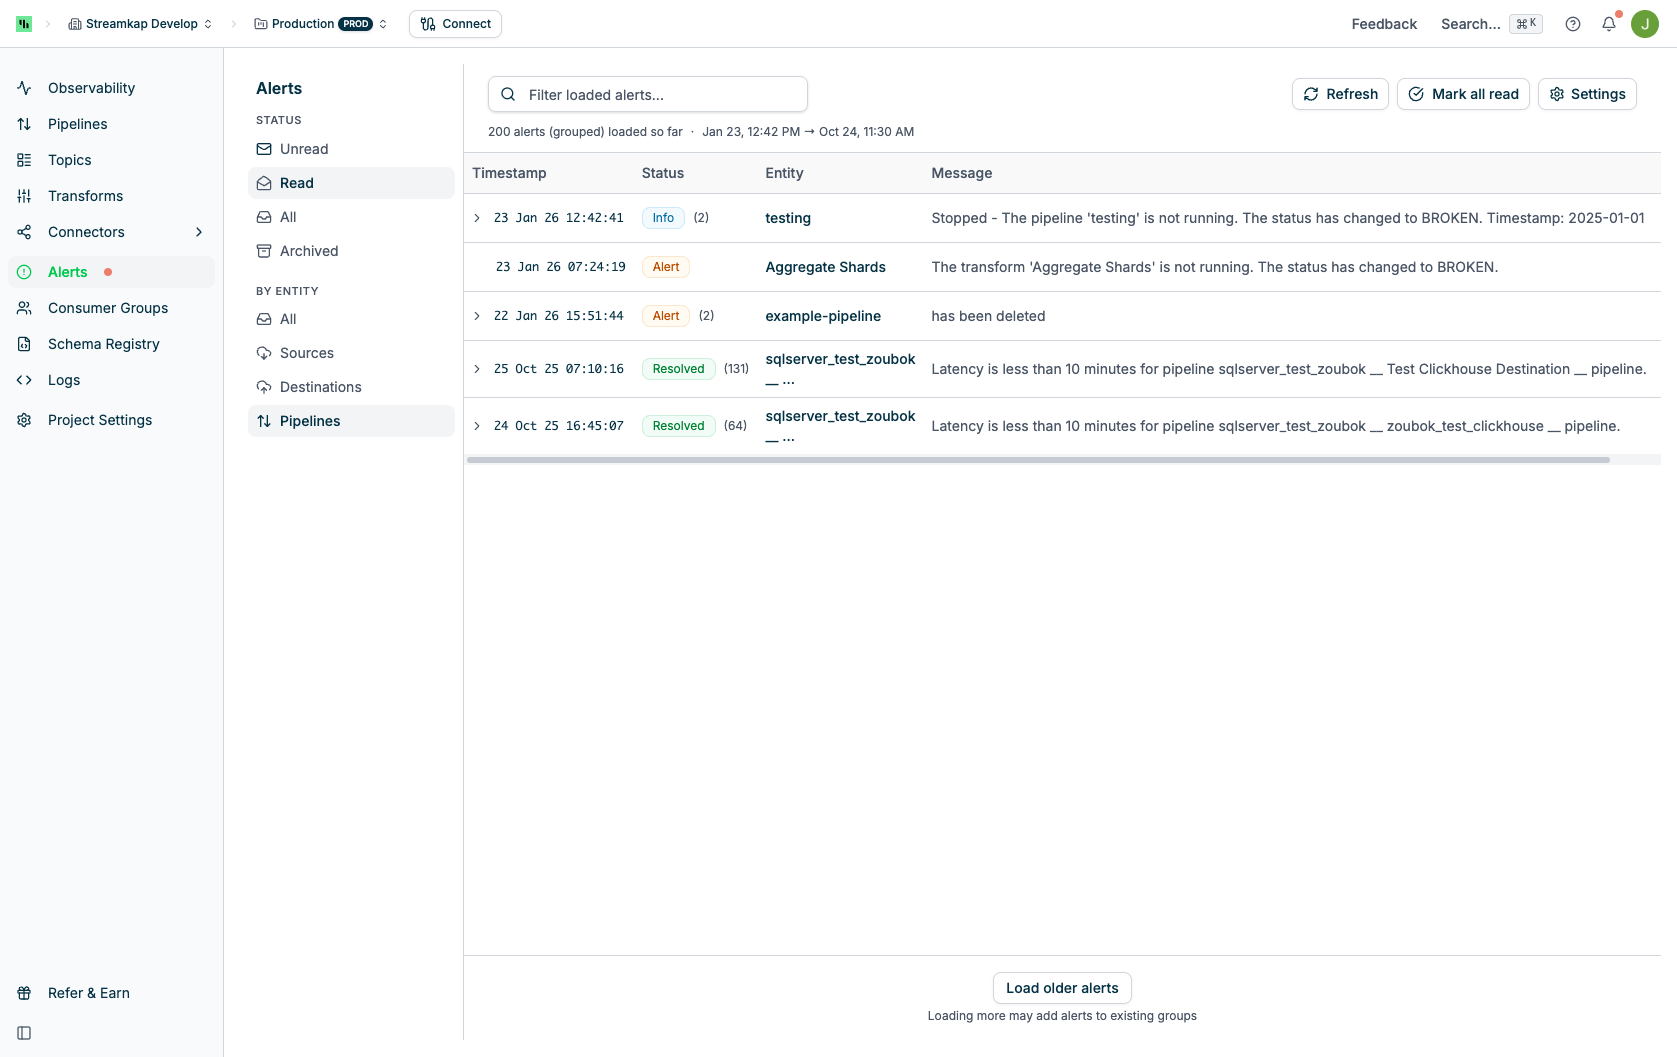
The Alerts page displays a chronological log of all events and notifications in your Streamkap service:
 ## Table Columns
The Alerts table displays the following information:
* **Name**: The resource name (connector, pipeline, service) that triggered the alert
* Click the name to navigate to the resource detail page
* Green names with dots indicate unread alerts
* **Type**: The resource type (Source, Destination, Pipeline, Service, etc.)
* **Issue**: A brief description of the alert event with an information icon
* Click to expand and view full details
* Common events: created, updated, deleted, stopped, resumed, broken, running
* **Date**: When the alert was triggered
* Relative time (e.g., "1 days ago")
* Absolute timestamp (e.g., "October 3rd at 7:06 PM")
* **Actions**: Envelope icon to toggle read/unread status
* Click the envelope icon to mark an unread alert as read
* Click the envelope icon to mark a read alert as unread
## Quick Actions
At the top of the page:
* **Search**: Filter alerts by searching issue text
* **Filter by tags**: Dropdown to filter by tags (Select All, Sources, Destinations, Pipelines)
* **Show only unread**: Checkbox to display only unread alerts
* **Show archived**: Checkbox to display only archived alerts
* **Mark all as read**: Button to mark all visible alerts as read
* **Alerts Settings**: Opens the configuration modal to manage integrations and preferences
## Alerts Configuration
Click the **Alerts Settings** button to open the configuration modal with two tabs: Settings and Preferences.
### Settings Tab
Configure integration channels to receive alerts outside the Streamkap app:
## Table Columns
The Alerts table displays the following information:
* **Name**: The resource name (connector, pipeline, service) that triggered the alert
* Click the name to navigate to the resource detail page
* Green names with dots indicate unread alerts
* **Type**: The resource type (Source, Destination, Pipeline, Service, etc.)
* **Issue**: A brief description of the alert event with an information icon
* Click to expand and view full details
* Common events: created, updated, deleted, stopped, resumed, broken, running
* **Date**: When the alert was triggered
* Relative time (e.g., "1 days ago")
* Absolute timestamp (e.g., "October 3rd at 7:06 PM")
* **Actions**: Envelope icon to toggle read/unread status
* Click the envelope icon to mark an unread alert as read
* Click the envelope icon to mark a read alert as unread
## Quick Actions
At the top of the page:
* **Search**: Filter alerts by searching issue text
* **Filter by tags**: Dropdown to filter by tags (Select All, Sources, Destinations, Pipelines)
* **Show only unread**: Checkbox to display only unread alerts
* **Show archived**: Checkbox to display only archived alerts
* **Mark all as read**: Button to mark all visible alerts as read
* **Alerts Settings**: Opens the configuration modal to manage integrations and preferences
## Alerts Configuration
Click the **Alerts Settings** button to open the configuration modal with two tabs: Settings and Preferences.
### Settings Tab
Configure integration channels to receive alerts outside the Streamkap app:
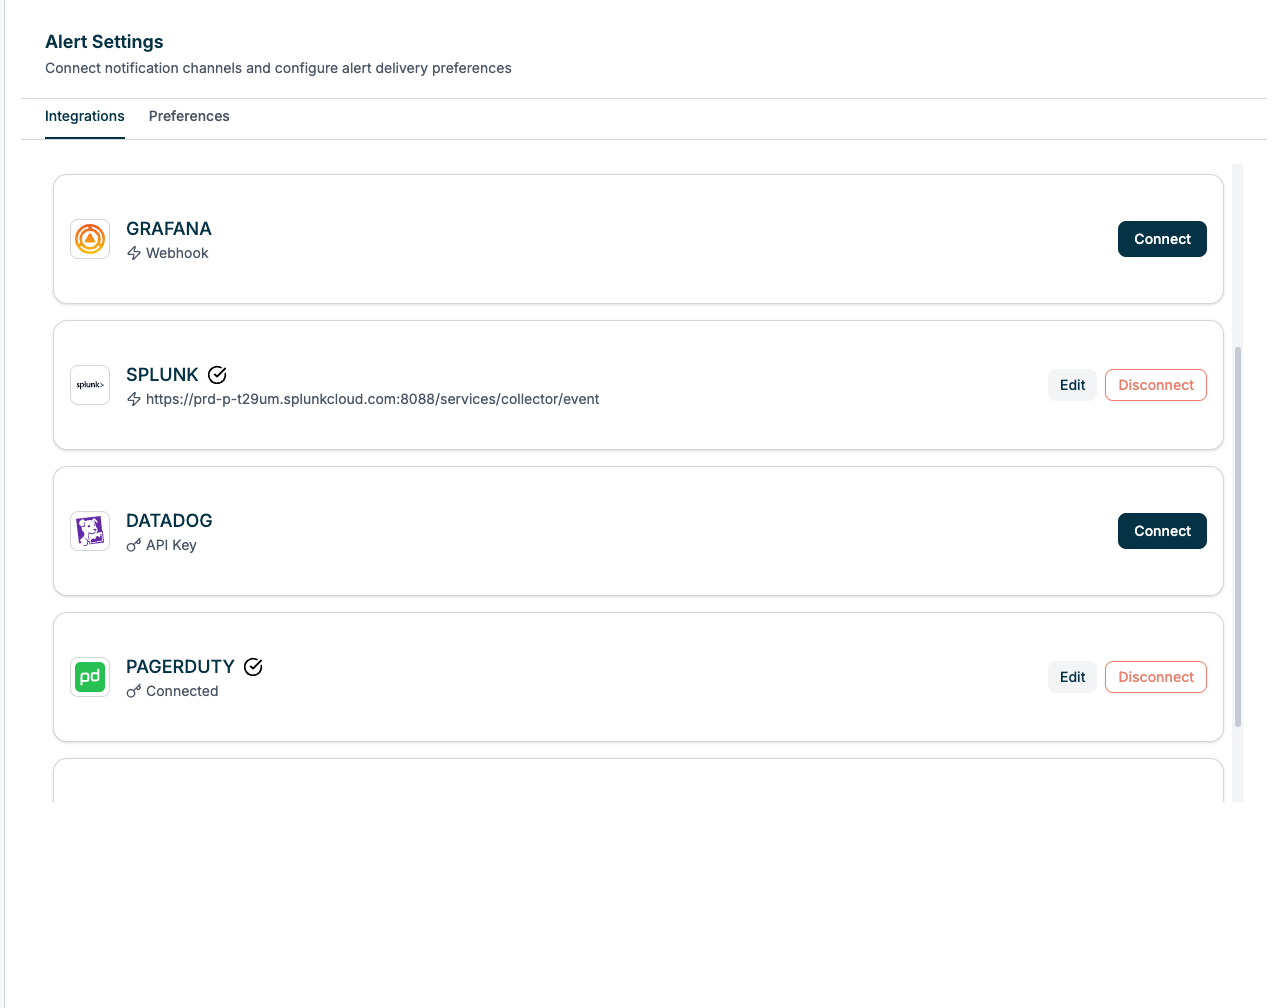 Available integrations:
**EMAIL**
* Status: Connect to configure email notifications
* Setup: Enter email address(es) to receive alerts
Available integrations:
**EMAIL**
* Status: Connect to configure email notifications
* Setup: Enter email address(es) to receive alerts
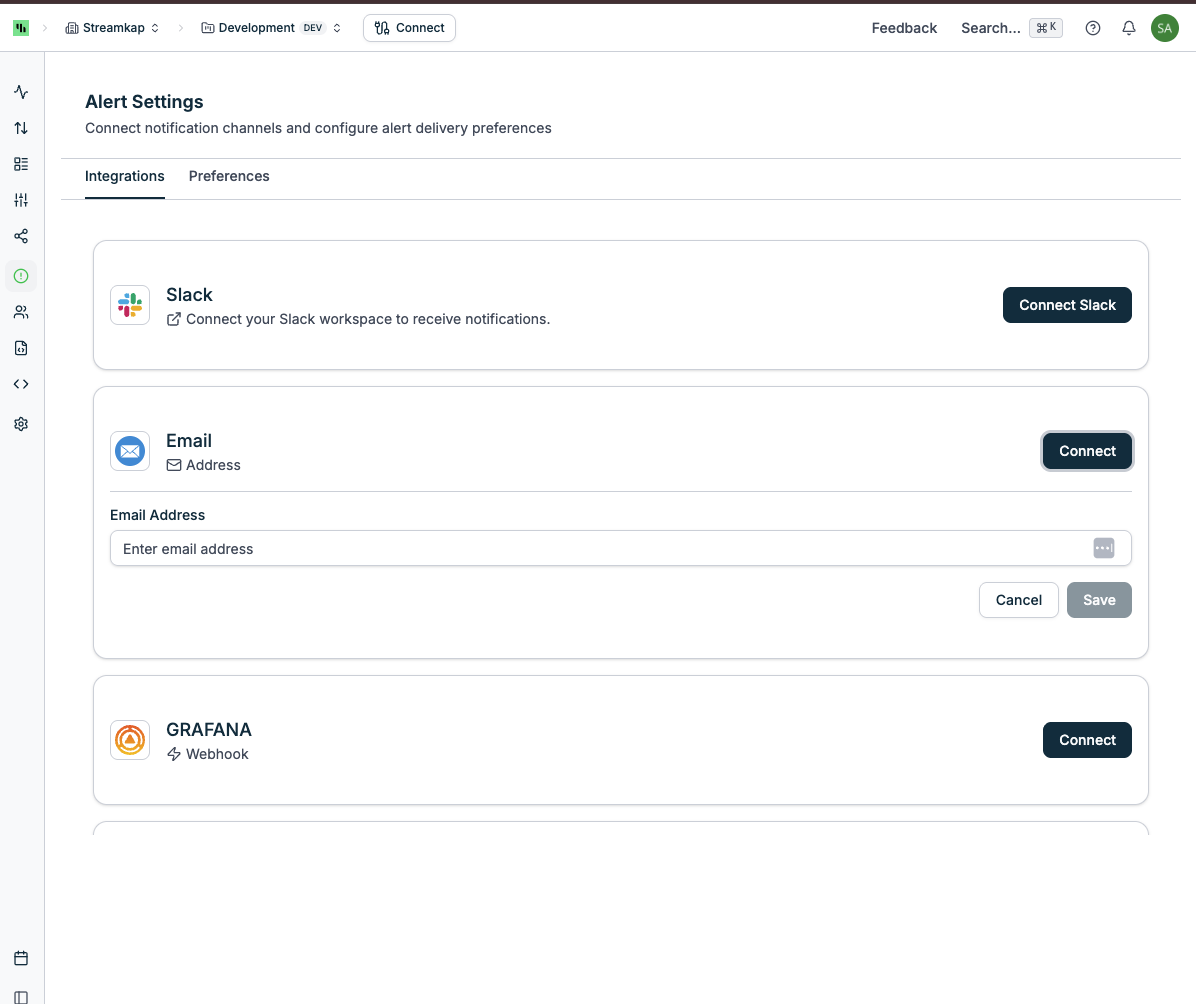 **SLACK**
* Status: Connect via OAuth
* Setup:
1. Click **Connect** Slack button
2. You’ll be redirected to Slack, where you can select the channel or user you want to receive the notification.
**SLACK**
* Status: Connect via OAuth
* Setup:
1. Click **Connect** Slack button
2. You’ll be redirected to Slack, where you can select the channel or user you want to receive the notification.
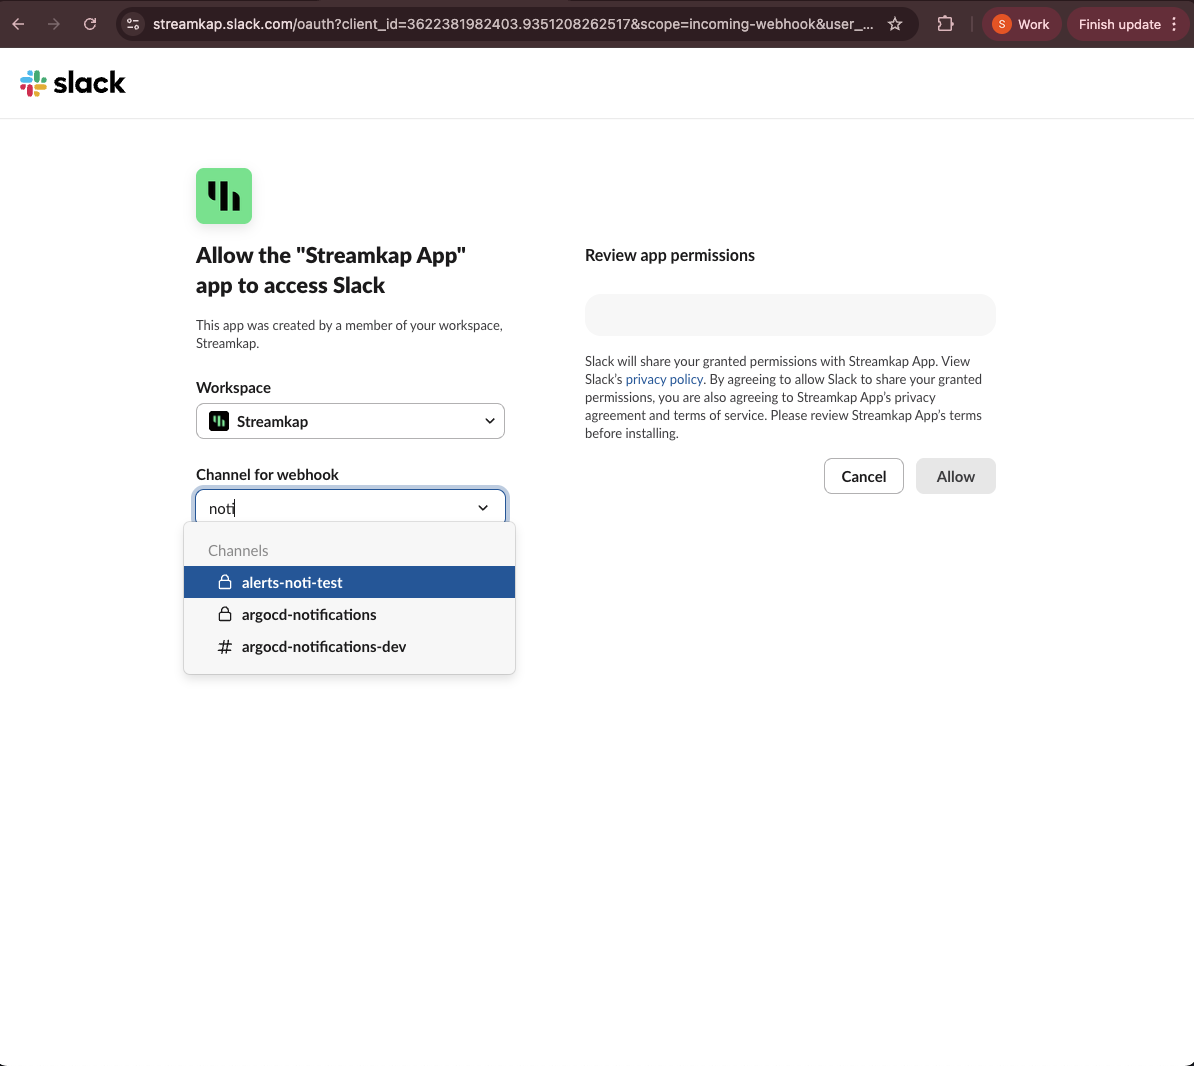 3. After clicking the **Allow** button, you’ll be redirected to the Alert settings page showing the connected channel or user.
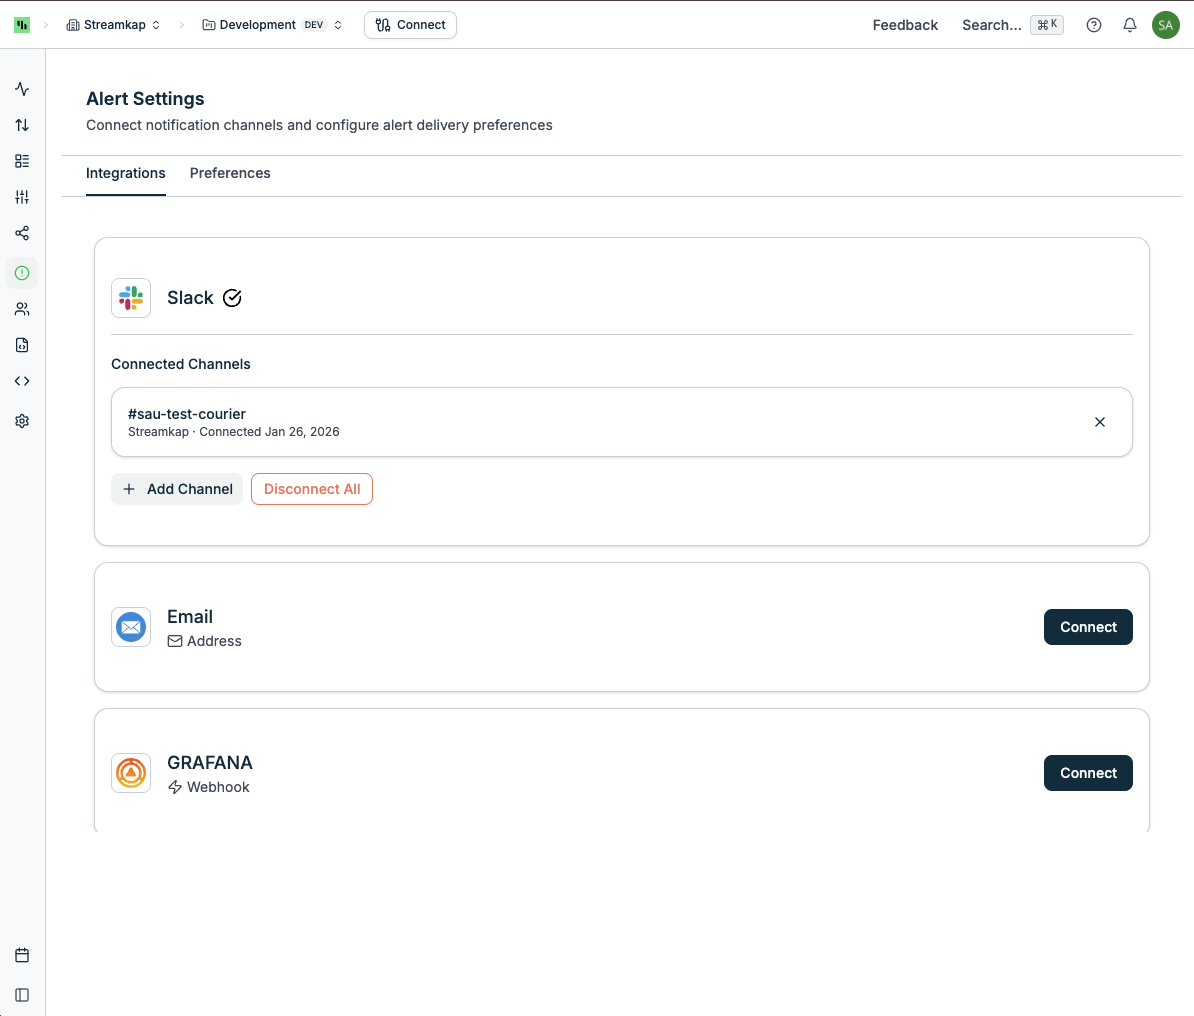 4. You can connect another channel or user by clicking **Add Channel** button.
**GRAFANA**
* Status: Example shows "Disconnect" button when connected
* Setup:
1. Go to **Grafana**
2. Navigate to **Alerts & IRM -> Alerting -> Contact points**.
3. Click **+ Add contact point**.
4. Enter a name for the contact point.
5. From the **Integration** list, select **Webhook**.
6. In the **URL** field, copy in your Webhook URL.
7. (Optional) Configure additional settings.
8. Click **Save contact point**.
9. Copy **Webhook URL** from **Grafana** and paste it into the **Webhook URL** field in the Alert Settings page, then click **Save**.
* Data format:
```
{
"data": {
"action_type": "stopped",
"datetime": "2026-01-14 21:53:06",
"entity_id": "685d6baefd035ce5558ad92f",
"entity_name": "example-source-mongodb",
"entity_type": "sources",
"message": "Source: example-source-mongodb has been stopped at 2026-01-14 21:53:06",
"pending_datetime": "2026-01-14 21:53:06",
"state": "TRIGGERERD",
"tenant_id": "c115d79d-5aef-4f6f-8185-a15901c993f8",
"threshold_value": "None",
"value": "None"
}
}
```
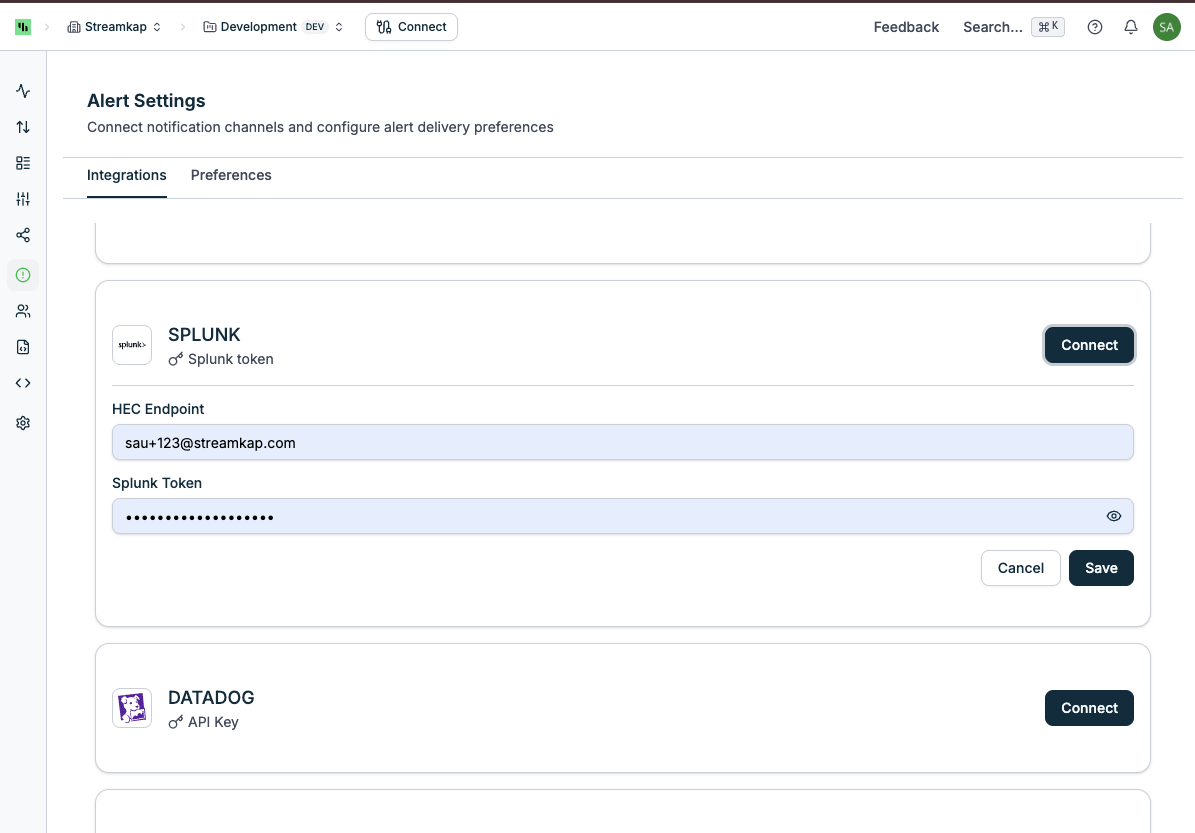
**SPLUNK**
* Status: The system will call the **/services/collector/event** to send data.
* Setup:
1. Go to **Splunk**
2. Navigate **Settings > Data inputs** and click **HTTP Event Collector**.
3. Click **New Token** button.
4. In the **Input Settings** step, do not need to add any index.
5. Click **Submit** button.
6. Copy the **Token Value** and paste it into the **Splunk Token** field in the Alert Setting page
7. Enter the **HEC endpoint** (Please use the https with port 443) and click **Save** button.
4. You can connect another channel or user by clicking **Add Channel** button.
**GRAFANA**
* Status: Example shows "Disconnect" button when connected
* Setup:
1. Go to **Grafana**
2. Navigate to **Alerts & IRM -> Alerting -> Contact points**.
3. Click **+ Add contact point**.
4. Enter a name for the contact point.
5. From the **Integration** list, select **Webhook**.
6. In the **URL** field, copy in your Webhook URL.
7. (Optional) Configure additional settings.
8. Click **Save contact point**.
9. Copy **Webhook URL** from **Grafana** and paste it into the **Webhook URL** field in the Alert Settings page, then click **Save**.
* Data format:
```
{
"data": {
"action_type": "stopped",
"datetime": "2026-01-14 21:53:06",
"entity_id": "685d6baefd035ce5558ad92f",
"entity_name": "example-source-mongodb",
"entity_type": "sources",
"message": "Source: example-source-mongodb has been stopped at 2026-01-14 21:53:06",
"pending_datetime": "2026-01-14 21:53:06",
"state": "TRIGGERERD",
"tenant_id": "c115d79d-5aef-4f6f-8185-a15901c993f8",
"threshold_value": "None",
"value": "None"
}
}
```
**SPLUNK**
* Status: The system will call the **/services/collector/event** to send data.
* Setup:
1. Go to **Splunk**
2. Navigate **Settings > Data inputs** and click **HTTP Event Collector**.
3. Click **New Token** button.
4. In the **Input Settings** step, do not need to add any index.
5. Click **Submit** button.
6. Copy the **Token Value** and paste it into the **Splunk Token** field in the Alert Setting page
7. Enter the **HEC endpoint** (Please use the https with port 443) and click **Save** button.
 * Data format:
```
{
"event": "Destination: Test anil 4 has been resumed",
"fields": {
"action_type": "resumed",
"datetime": "2026-01-07 14:46:46",
"entity_id": "67e41d2daea865c2ce982b55",
"entity_name": "Test anil 4",
"entity_type": "destinations",
"pending_datetime": "2026-01-07 14:46:46",
"state": "TRIGGERERD",
"tenant_id": "82d4a52a-987a-41ab-b199-ac02718a918f",
"threshold_value": "None",
"value": "None"
},
"source": "Streamkap"
}
```
**DATADOG**
* Status: The system will call the **Event v2 API** to send data.
* Setup:
1. Go to **Datadog**.
2. Navigate **User > API keys** and click **New Key** and create a new **API Key**.
3. Navigate **User > Application keys** and click **New Key** and create a new **Application Key** with:
* **Scope**: `events_read`
* **Actions API Access**: `Enabled`
4. Enter your **Datadog site (copy it from your Datadog page URL)**, **API Key**, and **Application Key**.
5. Click **Save**.
* Data format:
```
{
"event": "Destination: Test anil 4 has been resumed",
"fields": {
"action_type": "resumed",
"datetime": "2026-01-07 14:46:46",
"entity_id": "67e41d2daea865c2ce982b55",
"entity_name": "Test anil 4",
"entity_type": "destinations",
"pending_datetime": "2026-01-07 14:46:46",
"state": "TRIGGERERD",
"tenant_id": "82d4a52a-987a-41ab-b199-ac02718a918f",
"threshold_value": "None",
"value": "None"
},
"source": "Streamkap"
}
```
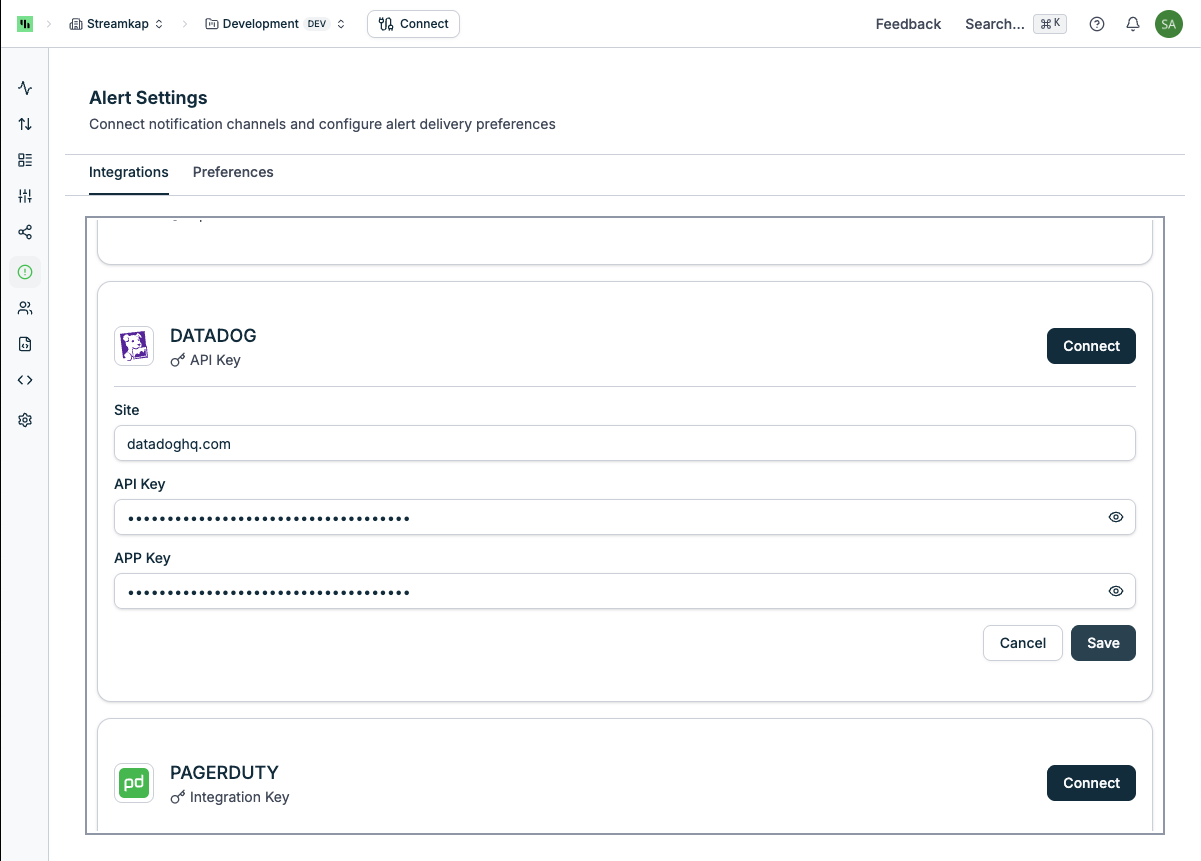
**DATADOG**
* Status: The system will call the **Event v2 API** to send data.
* Setup:
1. Go to **Datadog**.
2. Navigate **User > API keys** and click **New Key** and create a new **API Key**.
3. Navigate **User > Application keys** and click **New Key** and create a new **Application Key** with:
* **Scope**: `events_read`
* **Actions API Access**: `Enabled`
4. Enter your **Datadog site (copy it from your Datadog page URL)**, **API Key**, and **Application Key**.
5. Click **Save**.
 * Data format:
```
{
"data": {
"attributes": {
"attributes": {
"custom": {
"action_type": "resumed",
"datetime": "2026-01-07 14:46:46",
"entity_id": "67e41d2daea865c2ce982b55",
"entity_name": "Test anil 4",
"entity_type": "destinations",
"pending_datetime": "2026-01-07 14:46:46",
"state": "TRIGGERERD",
"tenant_id": "82d4a52a-987a-41ab-b199-ac02718a918f",
"threshold_value": "None",
"value": "None"
},
"status": "warn"
},
"category": "alert",
"host": "app.streamkap.com",
"message": "Destination: Test anil 4 has been resumed at 2026-01-07 14:46:46",
"tags": [
"source:streamkap"
],
"title": "Destination: Test anil 4 has been resumed"
},
"type": "event"
}
}
```
**PAGERDUTY**
* Status: The system will call the **Event v2 API** to send data.
* Setup:
1. Go to **PagerDuty**.
2. Navigate **Integration > Service integrations** and click **+ New Serivce** to create a new service.
3. In the **Integration** step, you must to choose the **Events API V2**, then click **Create Service** button.
4. Copy the **Integration Key** and paste it into the **Integration Key** field in the Alert Setting page
5. Click **Save**.
* Data format:
```
{
"data": {
"attributes": {
"attributes": {
"custom": {
"action_type": "resumed",
"datetime": "2026-01-07 14:46:46",
"entity_id": "67e41d2daea865c2ce982b55",
"entity_name": "Test anil 4",
"entity_type": "destinations",
"pending_datetime": "2026-01-07 14:46:46",
"state": "TRIGGERERD",
"tenant_id": "82d4a52a-987a-41ab-b199-ac02718a918f",
"threshold_value": "None",
"value": "None"
},
"status": "warn"
},
"category": "alert",
"host": "app.streamkap.com",
"message": "Destination: Test anil 4 has been resumed at 2026-01-07 14:46:46",
"tags": [
"source:streamkap"
],
"title": "Destination: Test anil 4 has been resumed"
},
"type": "event"
}
}
```
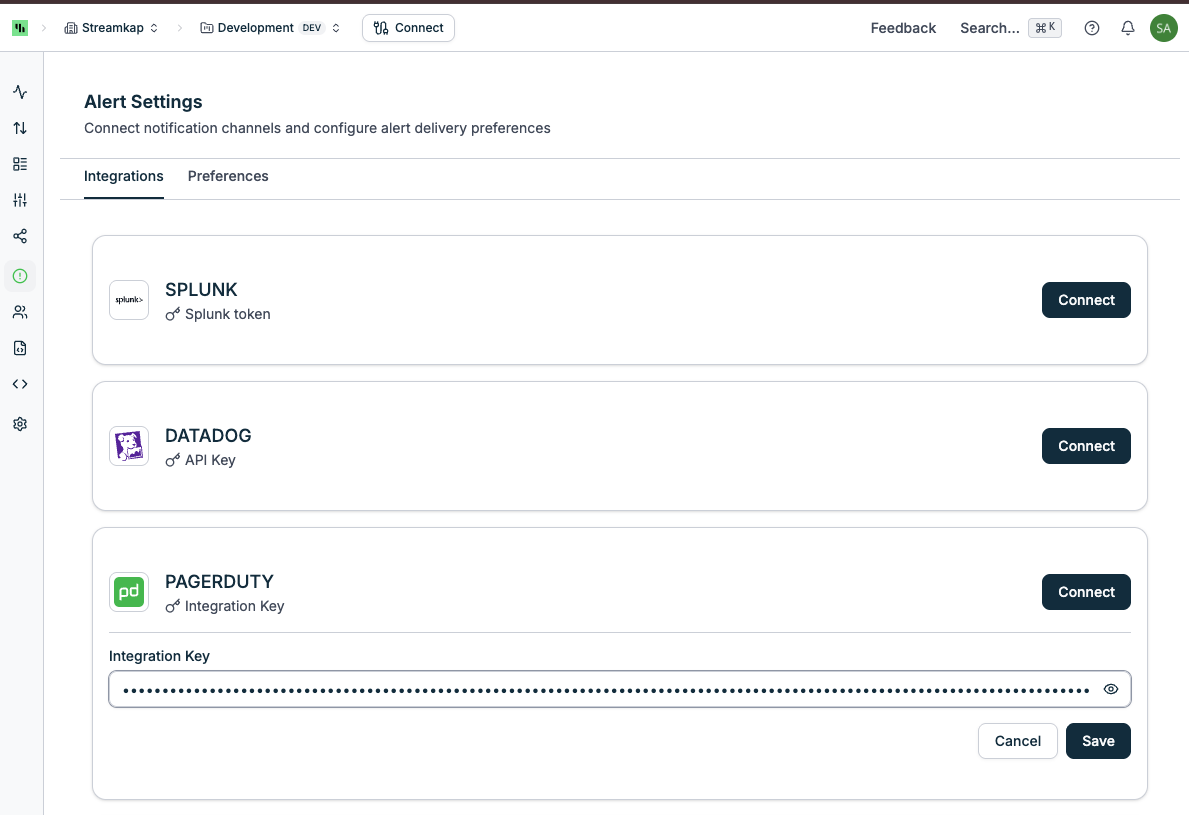
**PAGERDUTY**
* Status: The system will call the **Event v2 API** to send data.
* Setup:
1. Go to **PagerDuty**.
2. Navigate **Integration > Service integrations** and click **+ New Serivce** to create a new service.
3. In the **Integration** step, you must to choose the **Events API V2**, then click **Create Service** button.
4. Copy the **Integration Key** and paste it into the **Integration Key** field in the Alert Setting page
5. Click **Save**.
 * Data format:
```
{
"payload": {
"summary": "Destination: Test anil 4 has been resumed at 2026-01-07 14:46:46",
"source": "https://app.streamkap.com",
"severity": "error",
"custom_details": {
"action_type": "resumed",
"datetime": "2026-01-07 14:46:46",
"entity_id": "67e41d2daea865c2ce982b55",
"entity_name": "Test anil 4",
"entity_type": "destinations",
"pending_datetime": "2026-01-07 14:46:46",
"state": "TRIGGERERD",
"tenant_id": "82d4a52a-987a-41ab-b199-ac02718a918f",
"threshold_value": "None",
"value": "None"
}
}
}
```
**CUSTOM WEBHOOK**
* Type: Webhook
* Status: Connect to configure
* Setup: Provide incoming webhook URL and the authentication
* Available authetication:
* NONE
* BASIC: Need to provide username and password
* BEARER: Need to provide the bearer token
Each integration can be connected or disconnected independently. When connected, you'll see a "Disconnect" button and the webhook URL (for webhook-based integrations).
### Preferences Tab
Configure which alert types you want to receive and through which channels:
* Data format:
```
{
"payload": {
"summary": "Destination: Test anil 4 has been resumed at 2026-01-07 14:46:46",
"source": "https://app.streamkap.com",
"severity": "error",
"custom_details": {
"action_type": "resumed",
"datetime": "2026-01-07 14:46:46",
"entity_id": "67e41d2daea865c2ce982b55",
"entity_name": "Test anil 4",
"entity_type": "destinations",
"pending_datetime": "2026-01-07 14:46:46",
"state": "TRIGGERERD",
"tenant_id": "82d4a52a-987a-41ab-b199-ac02718a918f",
"threshold_value": "None",
"value": "None"
}
}
}
```
**CUSTOM WEBHOOK**
* Type: Webhook
* Status: Connect to configure
* Setup: Provide incoming webhook URL and the authentication
* Available authetication:
* NONE
* BASIC: Need to provide username and password
* BEARER: Need to provide the bearer token
Each integration can be connected or disconnected independently. When connected, you'll see a "Disconnect" button and the webhook URL (for webhook-based integrations).
### Preferences Tab
Configure which alert types you want to receive and through which channels:
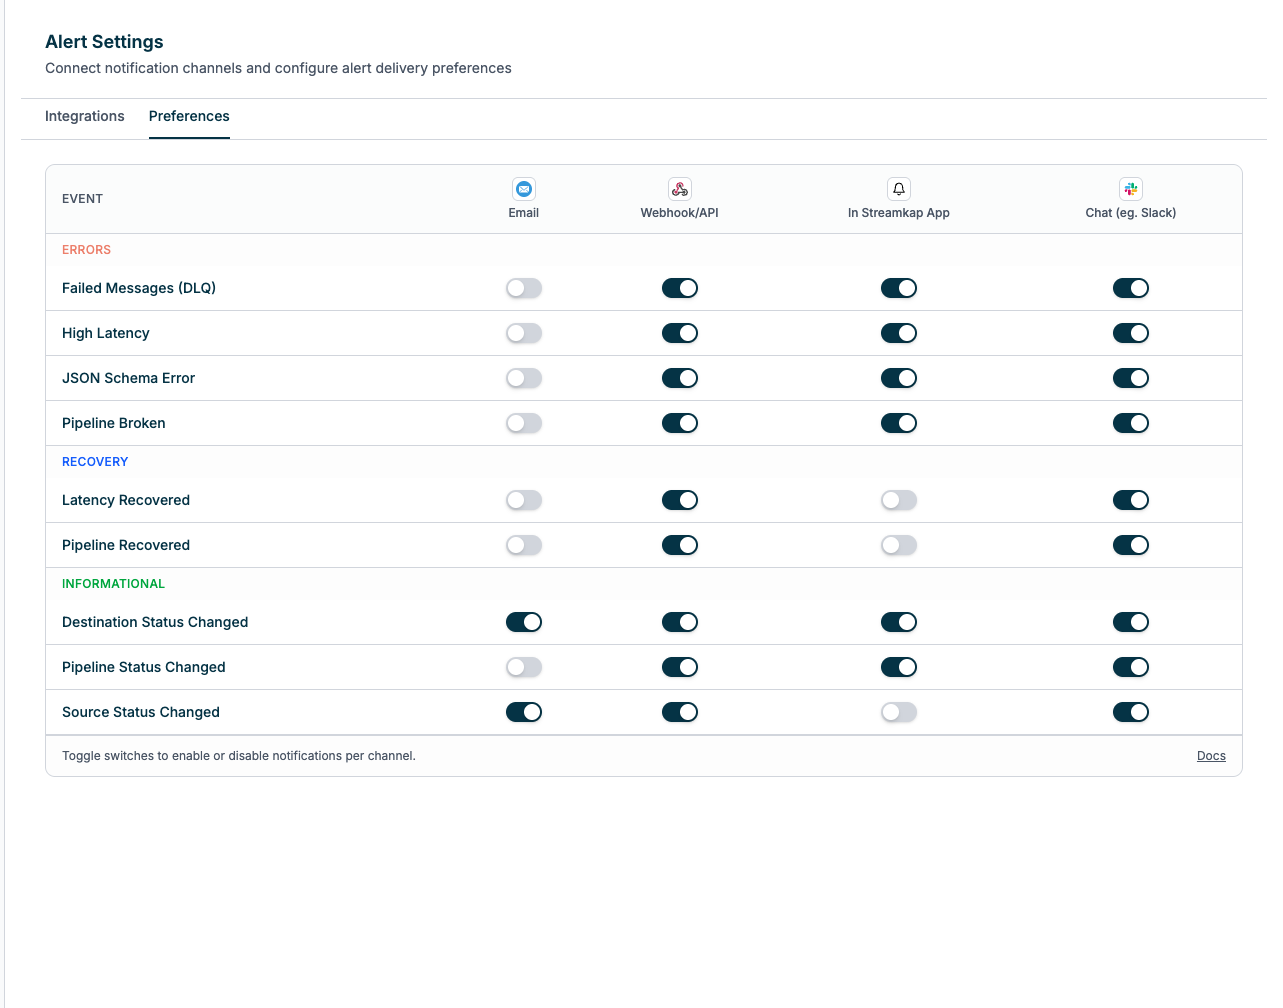 Alert categories and their enabled channels:
**Destination Actions**
* Events: Destination connector created, updated, deleted, stopped, resumed
* Default channels: (expand to configure)
**Pipeline Actions**
* Events: Pipeline created, updated, deleted, stopped, started
* Enabled channels: Email
**Recovery - Pipeline Is Running**
* Events: Pipeline recovered from error state and is now running
* Enabled channels: Email, In App, Chat & Webhook
**Recovery - Pipeline Latency less than 10 minutes**
* Events: Pipeline recovered from latency less than 10 minutes
* Enabled channels: Email, In App, Chat & Webhook
**Source Actions**
* Events: Source connector created, updated, deleted, stopped, resumed
* Enabled channels: Email, In App, Chat & Webhook
**Triggered - Pipeline Dead Letter Queue**
* Events: Messages sent to dead letter queue due to processing errors
* Enabled channels: Email, In App, Chat & Webhook
* Critical alert for data quality issues
**Triggered - Pipeline JSON Column**
* Events: Destination has any json columns
* Enabled channels: Email, In App, Chat & Webhook
* Critical alert for data quality issues
**Triggered - Pipeline Latency greater than 10 minutes**
* Events: Pipeline processing latency exceeds threshold
* Enabled channels: Email, In App, Chat & Webhook
* Important for monitoring real-time performance
**Triggered - Pipeline Not Running**
* Events: Pipeline stopped unexpectedly or failed to start
* Enabled channels: Email, In App, Chat & Webhook
* Critical alert for system availability
Click any alert category to expand and customize which channels receive notifications for that specific alert type.
## Setting Up Alerts
Click **Alerts** in the sidebar to view your alerts.
Click the **Alerts Settings** button in the top right corner.
In the **Settings** tab:
* Click **Connect** next to each integration you want to enable
* Follow the setup wizard for each channel:
* Email: Enter email addresses
* Slack: Authorize OAuth connection
* Teams/Discord/Mattermost/Grafana: Provide webhook URLs
* Test the connection to ensure proper configuration
Switch to the **Preferences** tab:
* Click on each alert category to expand it
* Select which channels should receive each type of alert
* Enable channels by checking the boxes (Email, In App, Chat & Webhook)
* Disable alerts you don't need by unchecking all channels
Your changes are saved automatically as you configure each setting.
## Alert Types
### Connector Events
**Source and Destination Actions**
* Created
* Updated (configuration changed)
* Deleted
* Stopped/paused
* Resumed/started
### Pipeline Events
**State Changes**
* Created
* Updated (settings modified)
* Deleted
* Started
* Stopped
* Broken (encountered error)
* Recovered (returned to running state)
**Performance Alerts**
* Pipeline latency exceeds 10 minutes
* Pipeline dead letter queue triggered
* Pipeline not running (unexpected stoppage)
### Service Events
* Service configuration changes
* Service status updates
* Resource quota alerts
## Alert Channels
### In-App Notifications
All alerts appear in the Alerts page within the Streamkap app. Unread alerts are indicated with green text and a dot indicator.
### Email Notifications
Receive alerts via email to configured addresses. Emails include:
* Alert title and severity
* Resource name and type
* Event description
* Timestamp
* Direct link to resource in Streamkap
### Slack Integration
Post alerts to Slack channels with rich formatting:
* Colored indicators based on severity
* Resource details and links
* Inline actions (when applicable)
* Thread support for related alerts
### Webhook Integrations
Teams, Discord, Mattermost, and Grafana receive alerts via webhooks with structured payloads including:
* Event metadata
* Resource information
* Timestamp
* Severity level
* Direct link to Streamkap
## Managing Alerts
### Marking Alerts as Read
* Click the envelope icon on an individual alert to toggle its read/unread status
* Click **Mark all as read** at the top to mark all visible alerts as read
* Unread alerts appear with green text and remain visible when "Show only unread" is enabled
### Filtering Alerts
* **Search**: Type in the search box to filter by issue text
* **Type**: Use the dropdown to show only specific resource types
* **Unread Toggle**: Enable "Show only unread" to hide alerts you've already seen
### Pagination
* View 20, 50, or 100 alerts per page using the dropdown
* Navigate between pages using Previous/Next buttons or page numbers
## Best Practices
1. **Configure Critical Alerts First**: Set up notifications for pipeline failures, dead letter queues, and high latency alerts
2. **Use Multiple Channels**: Configure both email and chat integrations for redundancy
3. **Customize by Environment**: Use different Slack channels or email lists for production vs. development services
4. **Review Regularly**: Check the Alerts page periodically to identify patterns or recurring issues
5. **Test Integrations**: After setting up webhooks, trigger a test alert to verify delivery
6. **Tune Thresholds**: Adjust latency thresholds and alert frequency to reduce noise while maintaining awareness
## Troubleshooting
### Not Receiving Alerts
If alerts aren't being delivered:
1. **Check Integration Status**: Ensure the integration shows "Connected" in Settings tab
2. **Verify Webhook URLs**: Copy and test webhook URLs in a tool like curl or Postman
3. **Check Email Spam**: Email alerts may be filtered as spam initially
4. **Review Preferences**: Confirm the alert type has the correct channels enabled
5. **Test Connection**: Disconnect and reconnect the integration
### Too Many Alerts
If you're overwhelmed with notifications:
1. **Disable Low-Priority Alerts**: Uncheck channels for informational alerts in Preferences
2. **Use Filters**: Set up separate channels for different severity levels
3. **Adjust Thresholds**: Consider increasing latency thresholds if appropriate
4. **Mute Specific Types**: Disable alerts for routine operations like connector updates
### Slack Not Posting
If Slack integration isn't working:
1. **Re-authorize**: Disconnect and reconnect the Slack integration
2. **Check Permissions**: Ensure the Streamkap app has permission to post in your workspace
3. **Verify Channel**: Confirm the target Slack channel still exists
4. **Test OAuth Token**: OAuth tokens may expire; reconnecting refreshes the token
## Related Documentation
* [Logs](/logs) - View detailed system logs for debugging
* [Pipelines](/pipelines) - Manage data pipelines
* [Sources](/sources) - Configure source connectors
* [Destinations](/destinations) - Configure destination connectors
* [Projects](/projects) - Manage Streamkap projects
Alert categories and their enabled channels:
**Destination Actions**
* Events: Destination connector created, updated, deleted, stopped, resumed
* Default channels: (expand to configure)
**Pipeline Actions**
* Events: Pipeline created, updated, deleted, stopped, started
* Enabled channels: Email
**Recovery - Pipeline Is Running**
* Events: Pipeline recovered from error state and is now running
* Enabled channels: Email, In App, Chat & Webhook
**Recovery - Pipeline Latency less than 10 minutes**
* Events: Pipeline recovered from latency less than 10 minutes
* Enabled channels: Email, In App, Chat & Webhook
**Source Actions**
* Events: Source connector created, updated, deleted, stopped, resumed
* Enabled channels: Email, In App, Chat & Webhook
**Triggered - Pipeline Dead Letter Queue**
* Events: Messages sent to dead letter queue due to processing errors
* Enabled channels: Email, In App, Chat & Webhook
* Critical alert for data quality issues
**Triggered - Pipeline JSON Column**
* Events: Destination has any json columns
* Enabled channels: Email, In App, Chat & Webhook
* Critical alert for data quality issues
**Triggered - Pipeline Latency greater than 10 minutes**
* Events: Pipeline processing latency exceeds threshold
* Enabled channels: Email, In App, Chat & Webhook
* Important for monitoring real-time performance
**Triggered - Pipeline Not Running**
* Events: Pipeline stopped unexpectedly or failed to start
* Enabled channels: Email, In App, Chat & Webhook
* Critical alert for system availability
Click any alert category to expand and customize which channels receive notifications for that specific alert type.
## Setting Up Alerts
Click **Alerts** in the sidebar to view your alerts.
Click the **Alerts Settings** button in the top right corner.
In the **Settings** tab:
* Click **Connect** next to each integration you want to enable
* Follow the setup wizard for each channel:
* Email: Enter email addresses
* Slack: Authorize OAuth connection
* Teams/Discord/Mattermost/Grafana: Provide webhook URLs
* Test the connection to ensure proper configuration
Switch to the **Preferences** tab:
* Click on each alert category to expand it
* Select which channels should receive each type of alert
* Enable channels by checking the boxes (Email, In App, Chat & Webhook)
* Disable alerts you don't need by unchecking all channels
Your changes are saved automatically as you configure each setting.
## Alert Types
### Connector Events
**Source and Destination Actions**
* Created
* Updated (configuration changed)
* Deleted
* Stopped/paused
* Resumed/started
### Pipeline Events
**State Changes**
* Created
* Updated (settings modified)
* Deleted
* Started
* Stopped
* Broken (encountered error)
* Recovered (returned to running state)
**Performance Alerts**
* Pipeline latency exceeds 10 minutes
* Pipeline dead letter queue triggered
* Pipeline not running (unexpected stoppage)
### Service Events
* Service configuration changes
* Service status updates
* Resource quota alerts
## Alert Channels
### In-App Notifications
All alerts appear in the Alerts page within the Streamkap app. Unread alerts are indicated with green text and a dot indicator.
### Email Notifications
Receive alerts via email to configured addresses. Emails include:
* Alert title and severity
* Resource name and type
* Event description
* Timestamp
* Direct link to resource in Streamkap
### Slack Integration
Post alerts to Slack channels with rich formatting:
* Colored indicators based on severity
* Resource details and links
* Inline actions (when applicable)
* Thread support for related alerts
### Webhook Integrations
Teams, Discord, Mattermost, and Grafana receive alerts via webhooks with structured payloads including:
* Event metadata
* Resource information
* Timestamp
* Severity level
* Direct link to Streamkap
## Managing Alerts
### Marking Alerts as Read
* Click the envelope icon on an individual alert to toggle its read/unread status
* Click **Mark all as read** at the top to mark all visible alerts as read
* Unread alerts appear with green text and remain visible when "Show only unread" is enabled
### Filtering Alerts
* **Search**: Type in the search box to filter by issue text
* **Type**: Use the dropdown to show only specific resource types
* **Unread Toggle**: Enable "Show only unread" to hide alerts you've already seen
### Pagination
* View 20, 50, or 100 alerts per page using the dropdown
* Navigate between pages using Previous/Next buttons or page numbers
## Best Practices
1. **Configure Critical Alerts First**: Set up notifications for pipeline failures, dead letter queues, and high latency alerts
2. **Use Multiple Channels**: Configure both email and chat integrations for redundancy
3. **Customize by Environment**: Use different Slack channels or email lists for production vs. development services
4. **Review Regularly**: Check the Alerts page periodically to identify patterns or recurring issues
5. **Test Integrations**: After setting up webhooks, trigger a test alert to verify delivery
6. **Tune Thresholds**: Adjust latency thresholds and alert frequency to reduce noise while maintaining awareness
## Troubleshooting
### Not Receiving Alerts
If alerts aren't being delivered:
1. **Check Integration Status**: Ensure the integration shows "Connected" in Settings tab
2. **Verify Webhook URLs**: Copy and test webhook URLs in a tool like curl or Postman
3. **Check Email Spam**: Email alerts may be filtered as spam initially
4. **Review Preferences**: Confirm the alert type has the correct channels enabled
5. **Test Connection**: Disconnect and reconnect the integration
### Too Many Alerts
If you're overwhelmed with notifications:
1. **Disable Low-Priority Alerts**: Uncheck channels for informational alerts in Preferences
2. **Use Filters**: Set up separate channels for different severity levels
3. **Adjust Thresholds**: Consider increasing latency thresholds if appropriate
4. **Mute Specific Types**: Disable alerts for routine operations like connector updates
### Slack Not Posting
If Slack integration isn't working:
1. **Re-authorize**: Disconnect and reconnect the Slack integration
2. **Check Permissions**: Ensure the Streamkap app has permission to post in your workspace
3. **Verify Channel**: Confirm the target Slack channel still exists
4. **Test OAuth Token**: OAuth tokens may expire; reconnecting refreshes the token
## Related Documentation
* [Logs](/logs) - View detailed system logs for debugging
* [Pipelines](/pipelines) - Manage data pipelines
* [Sources](/sources) - Configure source connectors
* [Destinations](/destinations) - Configure destination connectors
* [Projects](/projects) - Manage Streamkap projects